
Summarize and analyze this article with
Modern organizations rely on complex data pipelines that ingest, transform, and deliver data for analytics and AI. Ensuring these pipelines run smoothly is critical – any broken process, data error, or delay can cascade into flawed business decisions. Data pipeline observability is the practice of gaining end-to-end visibility into your data flows. It involves monitoring and analyzing data at each stage of the pipeline (ingestion, processing, storage, and consumption) to track data quality, performance, and integrity in real time. In essence, observability turns your pipelines from opaque “black boxes” into transparent processes where issues can be detected and resolved quickly. With robust observability in place, teams can trust that their data is accurate, up-to-date, and delivered on time for decision-making.
Without proper observability, errors often go unnoticed until they cause damage – for example, a silent schema change or a failed batch job might only be discovered after it produces incorrect reports. By contrast, an observable data pipeline will immediately alert engineers to anomalies like a sudden drop in record counts, a spike in null values, or a stalled processing job. This proactive insight is vital for maintaining data reliability and pipeline efficiency. In the following sections, we’ll explore how to architect data pipeline observability into your systems, the key challenges to watch out for, and best practices to ensure your data pipelines are both transparent and trustworthy.
Data Pipeline Observability Architecture
Implementing observability requires an architecture that embeds monitoring and logging throughout the entire data pipeline. Rather than treating observability as an afterthought, it should be woven into the pipeline’s design. Key components of a robust data pipeline observability architecture include:
Instrumentation & Logging
Instrument all pipeline components (extract jobs, transform scripts, load processes, etc.) to emit detailed logs and events. Every step should log successes, failures, and key data stats. For example, ingestion jobs might log the number of records ingested and any schema mismatches. These logs provide the raw data for troubleshooting and analysis.
Metrics Collection
Deploy agents or use built-in tools to collect metrics on performance and throughput. Important pipeline metrics include data throughput (rows/second), latency for each processing stage, error rates, and resource usage (CPU, memory of pipeline tasks). Collecting these metrics in a central repository (e.g., a time-series database or monitoring service) allows you to track trends and set thresholds for alerting.
Data Quality Checks
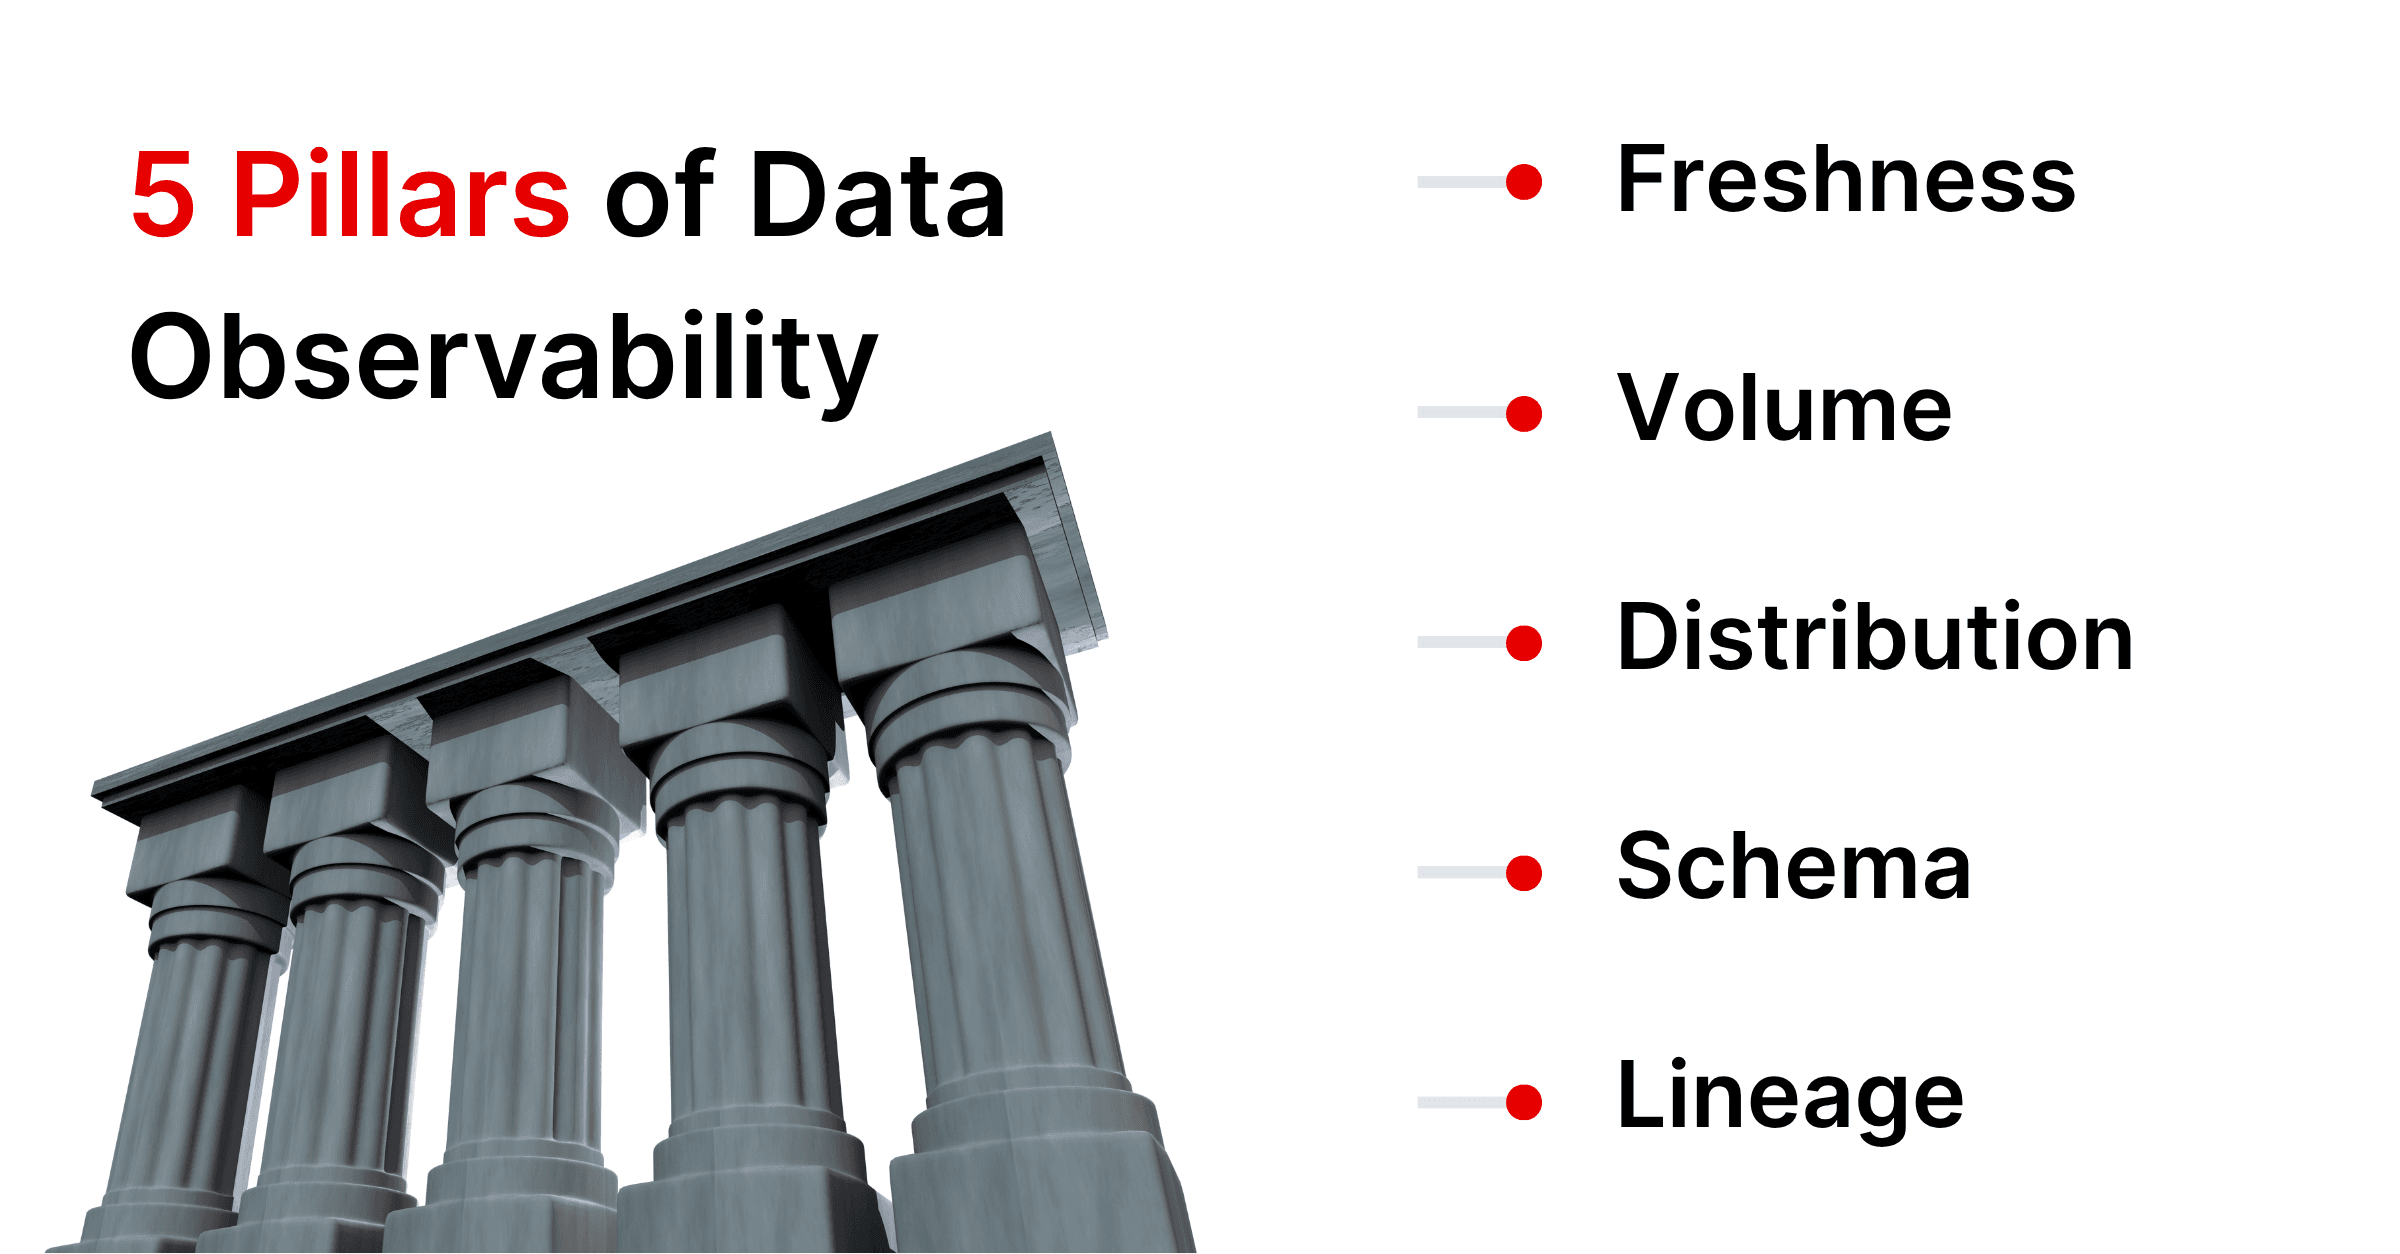
Incorporate automated data quality validations at key points. This means checking the five pillars of data health – freshness, volume, distribution, schema, and lineage – as data flows through the pipeline. For instance, verify that each batch arriving is on time and contains the expected number of records (freshness and volume checks), validate that values fall within expected ranges or categories (distribution checks), and detect any upstream schema changes (schema checks). These checks can be implemented via code or by using a data observability platform’s built-in rules.
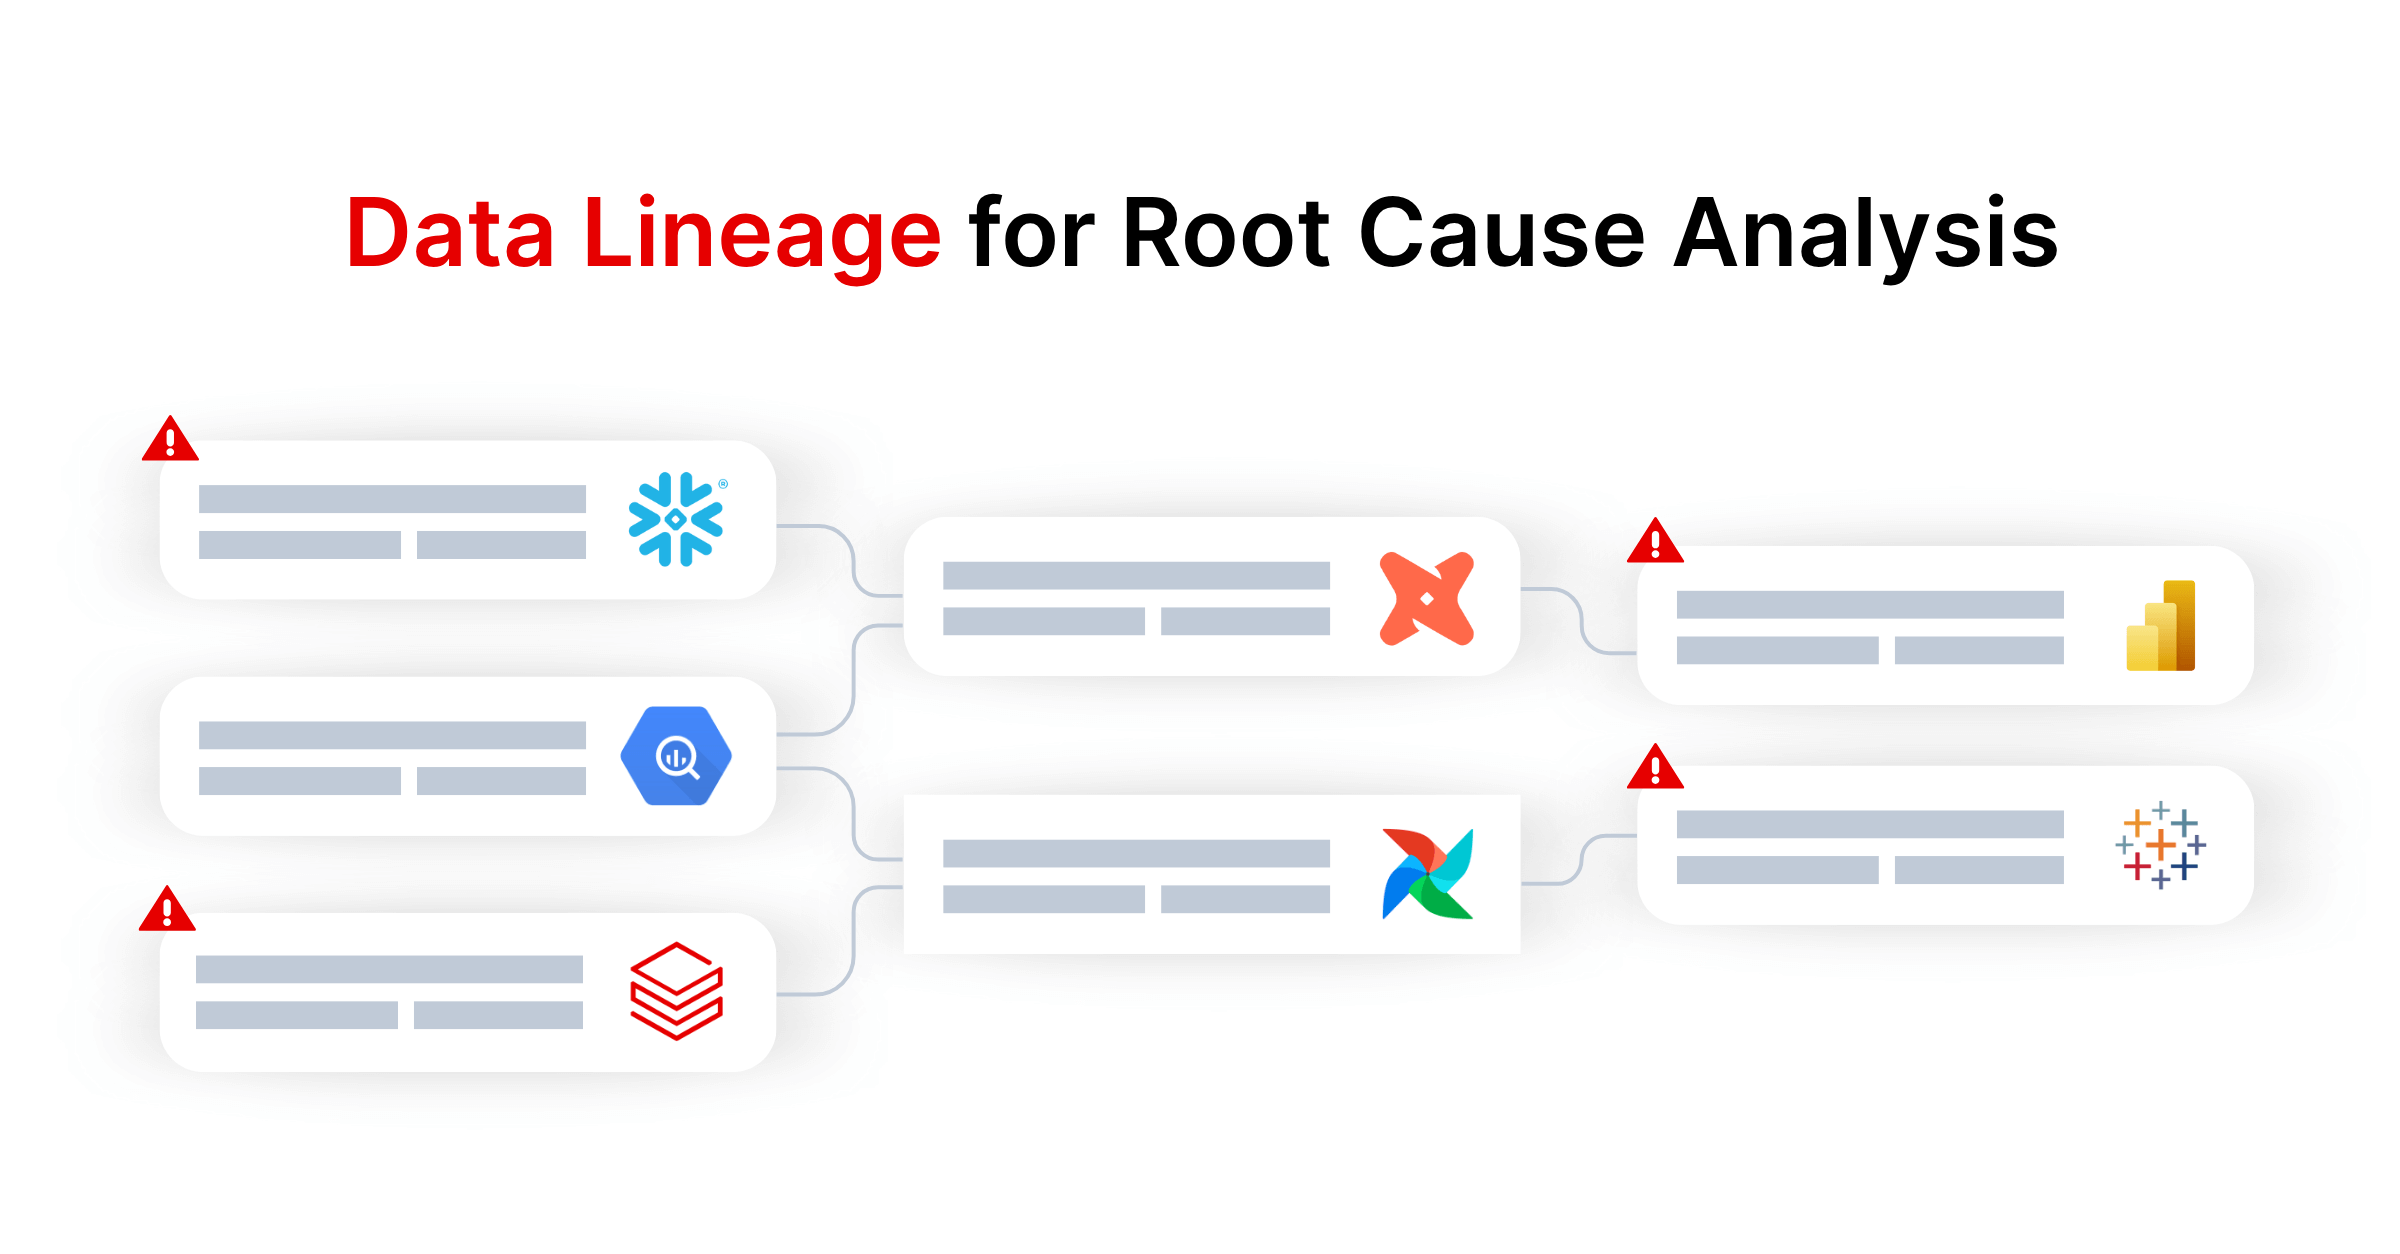
End-to-End Data Lineage
Build or integrate a lineage tracking system that records how data moves from source to destination through each transformation. A lineage graph is invaluable for observability – when a problem arises (like a report showing wrong data), engineers can trace upstream to find where the data was corrupted or delayed. Lineage metadata can be captured automatically by modern tools or by integrating with a data catalog. For example, connecting your pipeline to a cataloging tool (such as Atlan or Alation) can automatically map data dependencies and lineage.
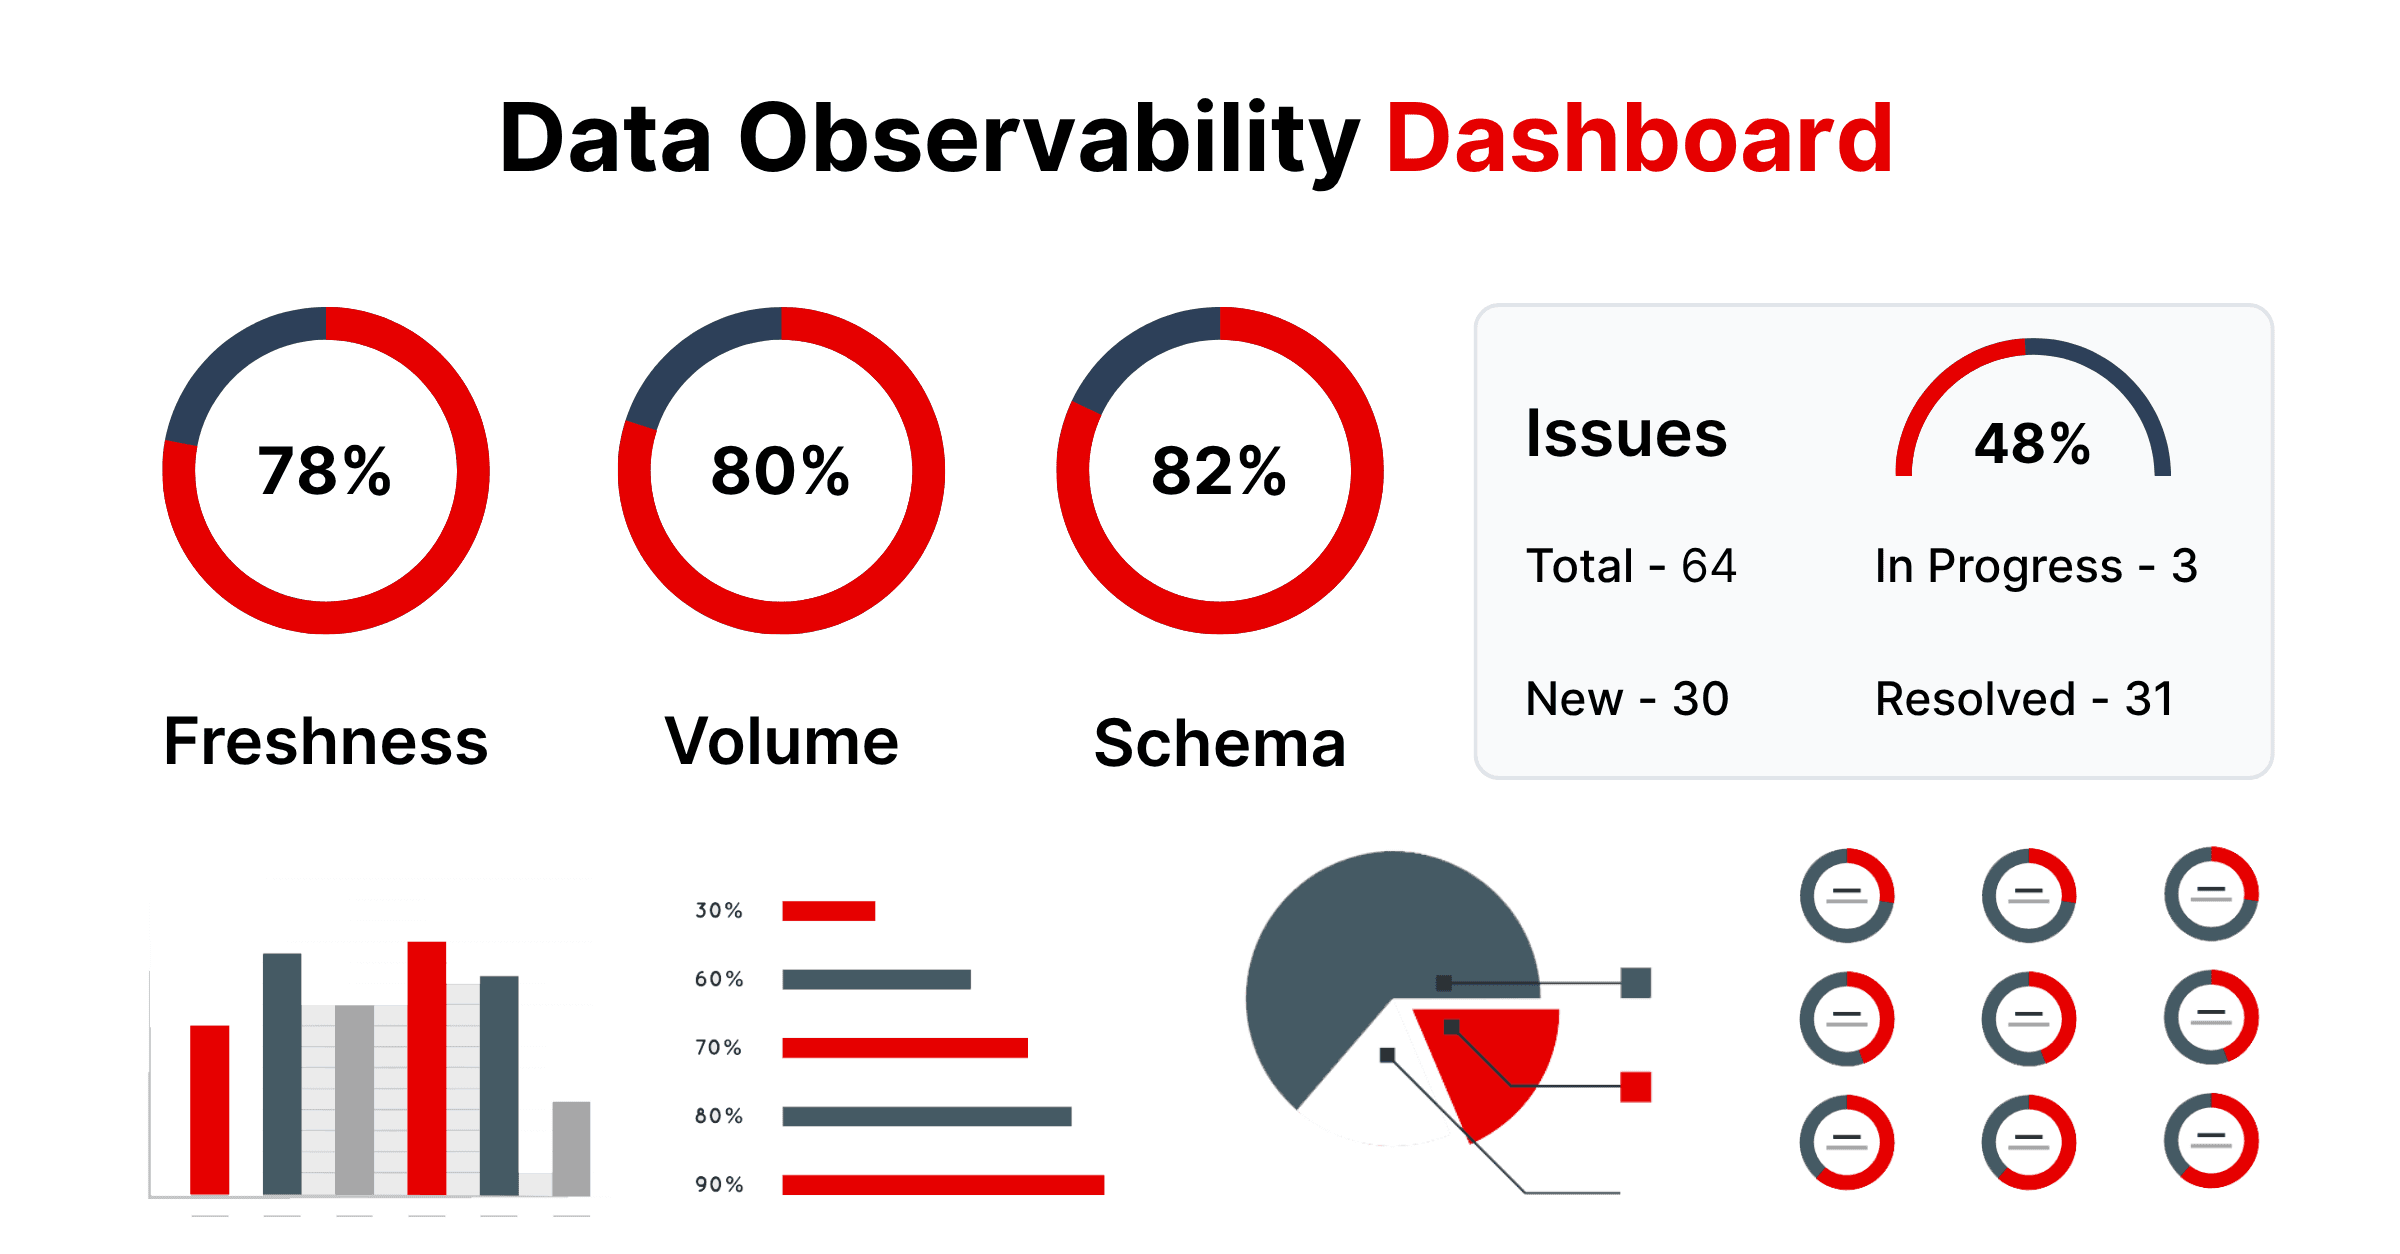
Central Monitoring Dashboard
Consolidate the above signals (logs, metrics, data quality alerts, lineage info) into a unified dashboard. This could be a custom observability portal or a third-party platform. The dashboard should provide real-time views of pipeline health: e.g., current throughput vs. normal ranges, any data quality anomaly alerts, which jobs are running or failed, and how long each stage takes. Dashboards help both engineers and stakeholders understand the pipeline’s status at a glance.
Alerting & Notification
Configure an alerting system that pushes notifications when something goes wrong or trends out of bounds. Observability architecture should define clear alert rules – for example, trigger an alert if a pipeline hasn’t delivered data by its scheduled time, or if error rate exceeds X%, or if a data quality check fails. Integration with communication tools (email, Slack, PagerDuty, etc.) ensures the right people get notified. It’s important that alerts are actionable and tied to the metrics that truly matter to avoid noise (more on that in Challenges and Best Practices).
Modular, Resilient Design
From an architectural perspective, design your data pipeline in modular components that can fail or scale independently. A monolithic pipeline is hard to observe and debug. Instead, separate it into logical stages (ingestion, processing, storage, reporting) with clear interfaces. This way, each stage can be monitored on its own, and if one component fails, it’s easier to pinpoint the issue. For example, if a data transform step fails, observability metrics and logs for that specific component will highlight the error, and downstream stages can be halted or isolated. Embracing a microservices or modular pipeline architecture greatly improves fault tolerance and makes your observability data more pinpointed to each component.
A well-planned observability architecture often leverages existing tools and cloud services. Many modern data platforms (like Snowflake, Databricks, or Amazon Redshift on AWS) provide native telemetry on query performance and resource usage. Pipeline orchestrators such as Apache Airflow or Azure Data Factory can emit logs and task metrics. The observability solution should integrate with these, pulling in telemetry from all sources into one view. In practice, organizations may choose a unified Data Observability platform (such as DQLabs) which simplifies this architecture by offering end-to-end monitoring and anomaly detection out of the box. For instance, DQLabs provides connectors to popular data warehouses, ETL tools, and BI platforms, allowing it to monitor pipelines (jobs, tasks, data quality checks) and even track usage patterns. An integrated platform can handle the heavy lifting of data collection, correlation, and even apply AI for anomaly detection, which accelerates the implementation of a full observability architecture. The goal is to have a seamless, centralized observability layer on top of your data pipeline – one that covers everything from raw data ingestion to the final data product, ensuring no blind spots.
Key Challenges in Achieving Observability
Building data pipeline observability is crucial, but it comes with its own set of challenges. Organizations often encounter these hurdles when implementing or scaling observability:
Fragmented Data Stack
Modern data pipelines span a multitude of tools and environments – from databases and data lakes to ETL/ELT services, cloud warehouses, and BI dashboards. Achieving a unified view is difficult when data and processing are siloed across systems. If your data is spread across, say, an on-prem database, a cloud warehouse like Snowflake, and various SaaS applications, stitching together observability across all those components is non-trivial. Lack of integration can lead to blind spots where parts of the pipeline go unmonitored.
Scalability and Data Volume
Observability solutions must handle the firehose of telemetry data without becoming overwhelmed. Large-scale pipelines (streaming data or very high-volume batches) produce massive logs and metrics. Tracking everything in real time and storing historical data for analysis can strain monitoring systems (and budgets). Teams struggle to keep up with growing data volumes – the risk is that monitoring lags or data gets sampled, causing potential issues to slip by. Designing an observability system that scales cost-effectively with your data growth is a constant challenge.
Data Quality and Schema Drift
One of the reasons to have observability is to catch data issues early, yet implementing comprehensive data quality checks for all pipelines is challenging. Data is always evolving; new sources get added, schemas change, and data values can drift from expected patterns. Ensuring that your observability covers these changes is difficult. For example, if an upstream team adds a new column or changes a data format without notice, your pipeline might break or produce incorrect results. Without robust schema and distribution monitoring, such changes might not be detected until far downstream. Thus, maintaining coverage for all possible data anomalies (and doing so across many datasets) is a big hurdle.
Integration Overhead
Tying together logs, metrics, and metadata from diverse tools requires significant engineering effort or a sophisticated platform. Many teams attempt to build DIY observability by scripting together open-source tools (Prometheus for metrics, ELK stack for logs, etc.). But integrating these, customizing them for data pipelines, and maintaining the integrations as systems change can eat up a lot of time. There’s also a challenge of ensuring observability doesn’t break when the pipeline technologies are updated or replaced. The overhead of integration can slow down observability adoption or result in partial implementations.
Alert Fatigue and Noise
An often-cited challenge is getting the alerting right. If your observability setup fires too many alerts, especially false positives or low-priority warnings, your team can quickly become desensitized. On the other hand, if alerts are too sparse or thresholds too lax, you might miss critical issues. Striking the balance is tough. Many organizations initially set up basic alerts (e.g., any job failure sends an email) and soon find themselves drowning in notifications. Reducing noise through smarter anomaly detection and alert prioritization is something that not every observability solution handles well, and it remains a pain point. Without careful tuning (or intelligent tools), observability can overwhelm engineers with data but not yield actionable insights.
Cost and Resource Constraints
Comprehensive observability can be expensive in both infrastructure and people time. Storing detailed logs for every pipeline run and fine-grained metrics for every system can quickly ramp up costs for cloud storage and monitoring services. Additionally, analyzing all that data may require skilled data engineers or SREs who understand both data and infrastructure – a skill set that’s in high demand. Smaller teams might find it challenging to dedicate resources to observability when they’re also trying to deliver features. There is often a trade-off between depth of observability and the budget available. Ensuring a cost-efficient observability strategy (e.g., by filtering out unnecessary data or using tiered storage for older telemetry) is part of this challenge.
Despite these challenges, the payoff of solving them is high: teams that conquer these hurdles get early-warning systems for pipeline issues and significantly reduce data downtime. In the next section, we outline best practices to address these challenges and build an effective observability practice.
Best Practices for Data Pipeline Observability
To successfully implement data pipeline observability, consider the following best practices. These strategies will help you maximize visibility while minimizing maintenance effort and noise:
Monitor Every Layer of the Pipeline
Adopt a multi-layered observability approach that spans from data ingestion to final consumption. This means instrumenting every step – source connectors, transformation scripts, loading into warehouses, and even the BI dashboards or ML models that consume the data. By covering each layer, you can trace issues wherever they occur. For example, monitor not just the pipeline jobs themselves but also upstream sources (are files arriving on time?) and downstream queries (are reports hitting stale data?). A holistic view ensures that no part of the data flow remains a blind spot. It can be helpful to use an observability platform that supports connectors for your entire stack (databases, cloud storage, ETL tools, streaming platforms, etc.), so all telemetry flows into one place. Comprehensive, end-to-end monitoring is the foundation of observability.
Automate Data Quality Checks and Alerts
The sooner you catch a data issue, the easier it is to fix – so build automated checks into your pipelines. Define data quality rules and anomaly detection jobs that run continuously. For instance, you might automatically verify that each batch’s row count is within an expected range or that critical fields aren’t null beyond a threshold. Leverage anomaly detection algorithms to flag unusual patterns (like a sudden spike in duplicate records or a drop in transactions from a particular source). When a rule is violated or an anomaly is detected, let the system generate an alert immediately. Automation here is key: it’s impractical to manually inspect data or logs at the volume modern pipelines operate.
Many modern tools, including DQLabs, provide out-of-the-box quality checks (for schema changes, volume anomalies, freshness delays, etc.) powered by AI/ML. Use these capabilities to catch issues like schema drift or data drift as soon as they happen. Automated alerts should be tuned with priority levels – for example, a minor delay might be a low-priority warning, whereas a data corruption triggers a high-priority alarm. By automating checks and tiering alerts by severity, you can ensure the team is notified promptly without being overwhelmed.
Implement Data Lineage for Root Cause Analysis
Invest in building a clear data lineage map across your pipelines. This is both a design-time and run-time practice. Document the dependencies of pipelines – which upstream sources feed into which transformations and which outputs (datasets, reports, etc.) depend on them. Then, use tooling to automatically capture lineage during pipeline runs (for example, log which source file or table version was used to produce each target table). Having end-to-end lineage readily accessible dramatically speeds up troubleshooting. When an alert fires – say a BI dashboard is showing incorrect data – lineage helps you trace back through the pipeline to find where the anomaly originated (maybe a specific upstream source had an issue or a particular transformation didn’t run).
Lineage is also essential for impact analysis: if a certain data source is delayed, lineage reveals all the downstream processes that will be affected, so you can proactively inform stakeholders. Make lineage information available in your observability dashboard, and keep it updated as pipelines change. This practice not only aids debugging but also contributes to better data governance and compliance (knowing where sensitive data comes from and goes). In summary, always know your data’s journey – it’s a cornerstone of effective observability and trust in data.
Leverage AI/ML for Proactive Observability
Modern data observability is moving beyond manual thresholds to intelligent insights. Embrace solutions that utilize machine learning to detect anomalies, correlate signals, and even recommend fixes. AI can analyze historical trends of your pipeline metrics and learn what “normal” looks like, then highlight deviations that a simple rule might miss. For example, ML-based models can flag a subtle drift in data values that develops over weeks or identify an unusual combination of events that typically precedes a pipeline failure.
Another advantage of AI is reducing alert fatigue – algorithms can prioritize alerts by importance, grouping related issues together, and suppressing insignificant noise. DQLabs, for instance, uses AI-driven anomaly detection to classify anomalies by high/medium/low priority based on how far they deviate from historical patterns. This means your team sees the most critical issues first and isn’t flooded by every minor fluctuation. Incorporating machine learning can also enable predictive maintenance of pipelines (forecasting that a job will fail or a capacity limit will be reached soon). While AI/ML is not a silver bullet, it significantly enhances observability when applied to large, dynamic data environments. The best practice here is to be proactive: don’t just react to failures but use advanced analytics to anticipate and prevent them when possible.
By following these best practices, your team can build a resilient and transparent data pipeline ecosystem—and maximize your data observability ROI. Start with a solid foundation of metrics and logging, then layer in data quality checks, integration, and intelligence. It’s also wise to foster a culture around observability – treat data pipeline issues with the same rigor that DevOps teams treat application downtime. Many organizations are now embracing DataOps principles, where data engineers and ops collaborate closely, using observability tools to continuously improve pipeline reliability. Remember that implementing observability is an iterative journey: begin with key pipelines and metrics, demonstrate the quick wins (like catching errors early), and gradually expand coverage and sophistication. Over time, you’ll develop a mature observability practice that not only finds problems faster but also provides insights to optimize the performance and efficiency of your data pipelines.
Conclusion
In today’s data-driven world, pipeline observability is no longer optional – it’s a necessity. A well-architected observability framework helps data engineers ensure that data moving across complex, distributed pipelines remains trustworthy and timely. We’ve discussed how to design an observability architecture that covers all bases, the common pitfalls to be aware of, and actionable best practices to put into place. By investing in the right tools and practices – from comprehensive monitoring and lineage tracking to automated, intelligent anomaly detection – organizations can dramatically reduce data downtimes and surprises. The result is a more reliable data infrastructure that stakeholders can rely on for critical decisions.
Finally, consider leveraging unified platforms like DQLabs to accelerate your observability implementation. These platforms provide many of the capabilities discussed (end-to-end monitoring, built-in data quality rules, AI-driven insights, and seamless integration with modern data stacks) in one package, allowing teams to focus on using insights rather than building plumbing. With strong data pipeline observability, your team can confidently deliver high-quality data continuously, turning your data pipelines into a competitive advantage rather than a potential single point of failure.