
Summarize and analyze this article with
Modern organizations run on data – but if that data is untrustworthy or unavailable at critical moments, decisions and operations suffer. In fact, Gartner estimates that poor data quality costs companies an average of $12.9 million annually. To mitigate such risks, data teams are investing in both data quality solutions and data observability tools that promise a holistic view of data health. Let’s understand the overlaps and differences between the two.
What Is Data Observability?
Data observability is the ability to holistically understand and monitor the state of data and data systems over time. In practice, data observability means continuously tracking your data pipelines, data stores, and data usage for signs of trouble – detecting anomalies or changes in data and infrastructure that could signal issues. According to Gartner’s definition, data observability tools “enable organizations to understand the state and health of their data, data pipelines, data landscapes, data infrastructures, and even the financial cost of data” by continuously monitoring, alerting, analyzing, and troubleshooting to prevent data errors or downtime. In simpler terms, it’s like having a 24/7 diagnostics system for your data ecosystem that raises a flag when something is wrong or unexpected.
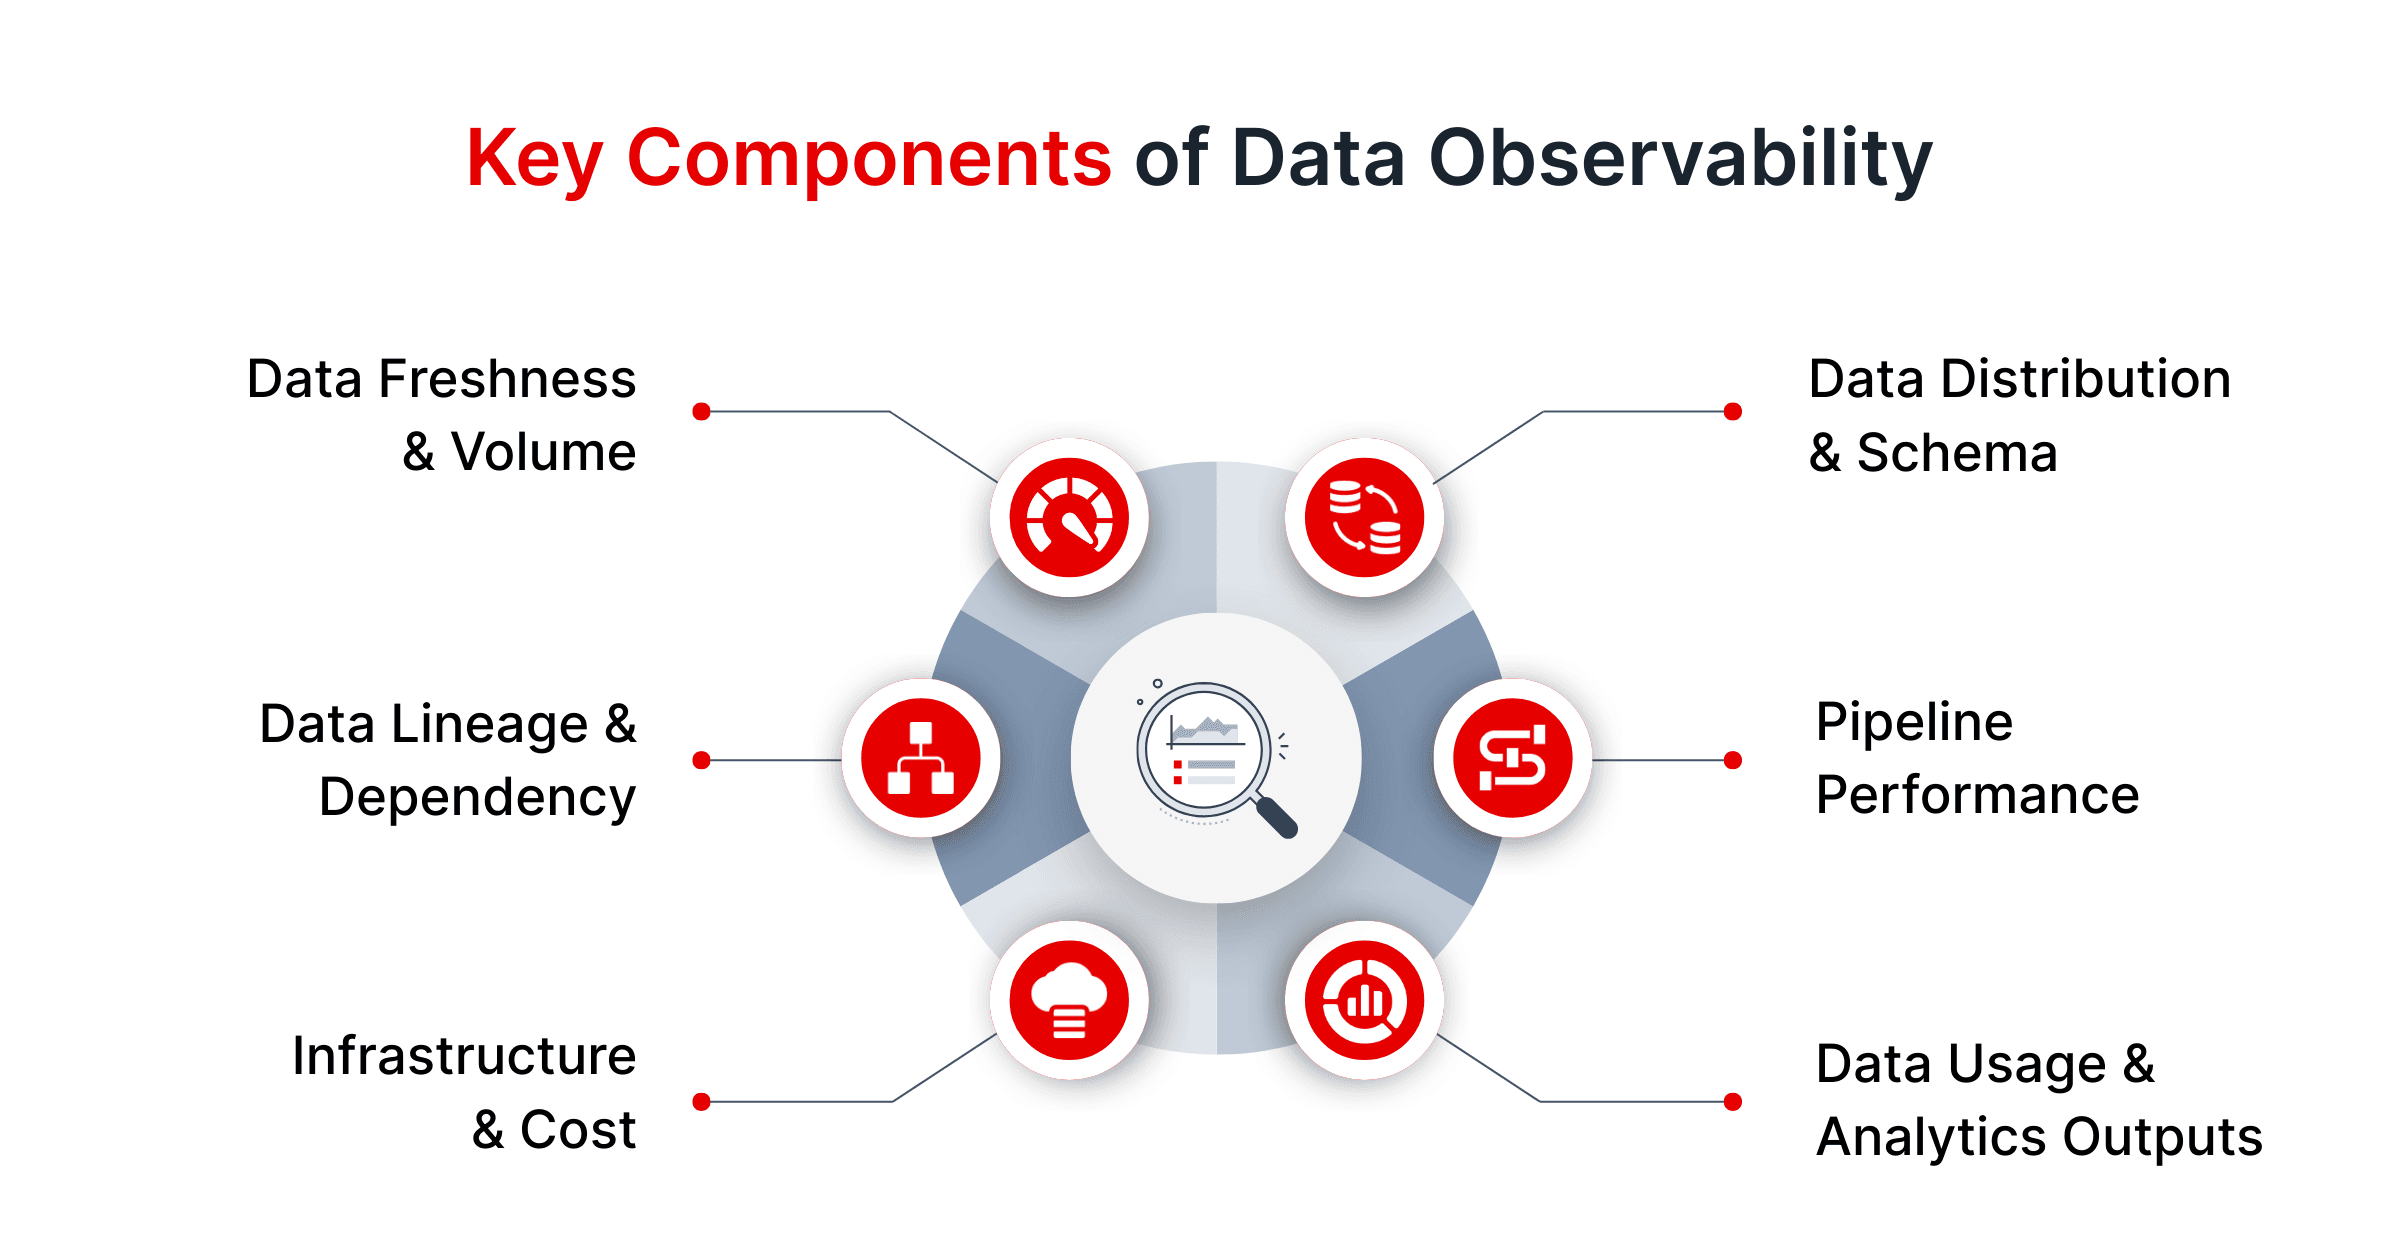
Key components of data observability often include monitoring several core aspects of data and pipeline health (sometimes called the “pillars” of data observability). These typically cover:
- Data Freshness & Volume: Is data arriving on time and in expected amounts? (e.g., detect if yesterday’s data load is delayed or half the usual size).
- Data Distribution & Schema: Is the data’s content within normal ranges and structures? (e.g., detect anomalies in values, sudden spikes in nulls, or schema changes in a source table).
- Data Lineage & Dependency: Can we trace where data comes from and how it moves? (e.g., tracking upstream changes that lead to downstream issues).
- Pipeline Performance: Are data pipelines and ETL/ELT jobs running properly? (e.g., monitor for failed jobs, increased latency, or resource usage issues in your data flow).
- Infrastructure & Cost: Is the underlying data infrastructure healthy and efficient? (e.g., monitoring warehouse compute utilization, storage spikes, or unusual query patterns that drive up cost).
- Data Usage & Analytics Outputs: How are end-users consuming the data? (e.g., tracking dashboard refreshes, BI query performance, and anomalies in analytical results).
In essence, data observability extends traditional application monitoring into the realm of data. It not only watches technical metrics, but also keeps an eye on data quality signals in real-time – so you can discover unknown issues (“unknown unknowns”) that you weren’t explicitly testing for.
DQLabs Example: DQLabs provides a multi-layered data observability capability, meaning it monitors everything from basic data health metrics up to advanced analytics and business KPIs in one solution. It can detect data reliability issues across all your data, alerting you to anomalies in freshness, schema, volume, and more (“Observe”) and even providing context like lineage to help pinpoint root causes. DQLabs’ observability is AI-driven and autonomous, using machine learning to learn normal patterns, minimize false alarms, and assist with remediation.
What Is Data Quality?
Data quality refers to the condition of a dataset relative to its intended use – essentially, how fit-for-purpose and reliable the data is for driving business outcomes. High-quality data is accurate, complete, consistent, timely, valid, and unique enough to serve its business objectives. In other words, if data observability is about watching the systems and pipelines, data quality is about ensuring the data itself is correct and useful.
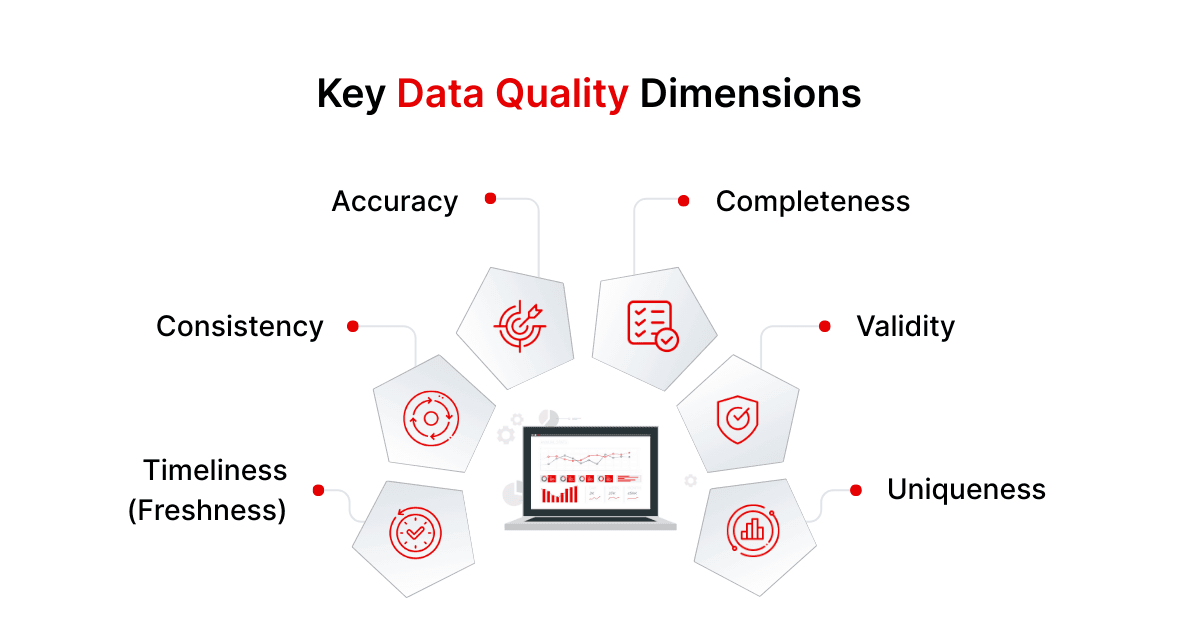
Data quality is commonly measured across well-defined dimensions:
- Accuracy: Does the data correctly reflect the real-world entities or events it’s supposed to represent? (For example, a customer’s recorded address should be their actual address.)
- Completeness: Is all required information present? (For instance, no missing values in mandatory fields).
- Consistency: Is the data uniform across the enterprise? (e.g., if two databases store the same entity, they shouldn’t conflict on key values).
- Validity: Does the data conform to the expected formats and business rules? (e.g., dates in the correct format, values within allowed ranges).
- Timeliness (Freshness): Is the data up-to-date and available when needed? (This might overlap with freshness in observability – e.g., ensuring a daily feed is current).
- Uniqueness: Is there unnecessary duplication? (e.g., no duplicate records where uniqueness is expected, such as customer IDs or transaction numbers.)
- Integrity: Are data relationships and references valid across systems? (e.g., all foreign key references point to existing, valid records.)
Ensuring data quality typically involves a suite of data quality management (DQM) practices and tools. Key components include data profiling (examining data to uncover anomalies or patterns), data cleansing (correcting or removing erroneous data), standardization (enforcing consistent formats), and validation rules (business logic checks that data must pass). It also encompasses ongoing monitoring of quality metrics and issue resolution workflows to continuously improve data integrity. The goal is to deliver data that stakeholders can trust for analytics, AI/ML, reporting, and operations.
DQLabs Example: It automates many DQM steps with AI – for instance, automatically profiling datasets and applying a semantic layer to identify data domains, which then helps generate appropriate quality rules and checks without extensive manual effort. DQLabs supports no-code rule creation for enforcing custom quality policies and uses ML to detect outliers or pattern violations (augmenting traditional rule-based checks with anomaly detection). The platform’s focus on delivering “fit-for-purpose” data means it ties data quality to business outcomes – e.g., providing business quality scores and dashboards that show how ready a dataset is for a particular use case. All these quality features work in tandem with observability features in one unified interface.
Key Differences Between Data Observability and Data Quality
Both data observability and data quality aim to increase trust in data, but they approach the problem from different angles. For data teams, it’s important to understand their different scope, purpose, components, and outcomes. Here are the key differences:
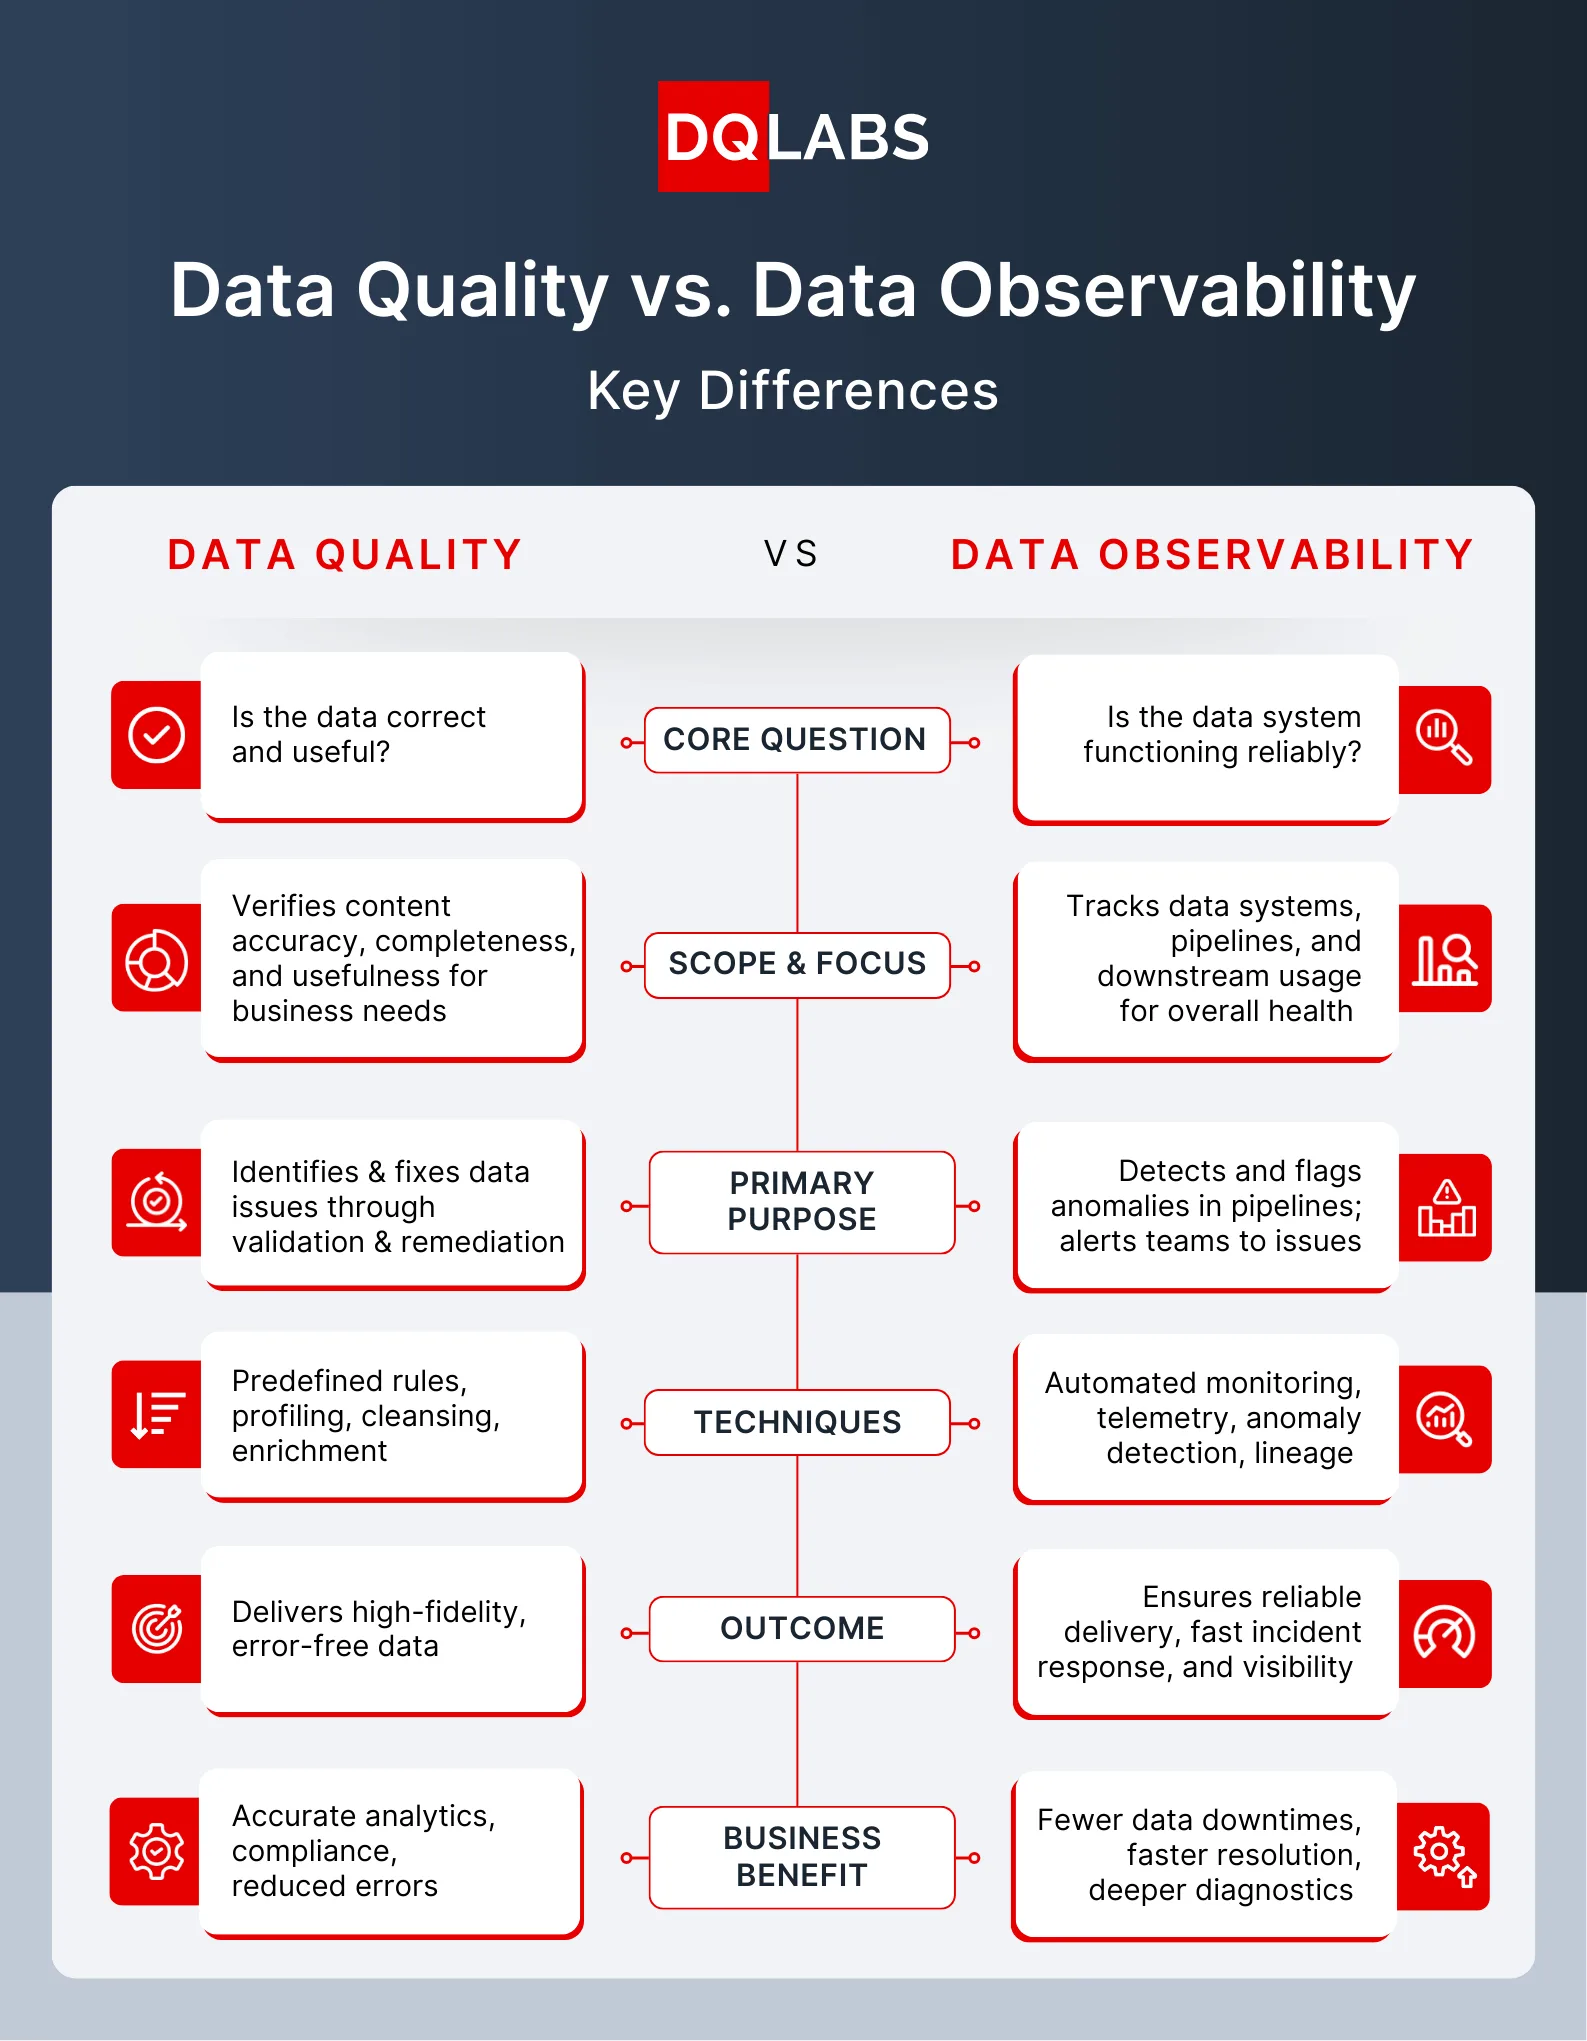
- Scope & Focus: Data Quality is concerned with the data itself in a business context – verifying the content of data meets business requirements (accuracy, completeness, etc.) for its intended use. Data Observability, on the other hand, has a broader scope that includes the systems and environment delivering the data. Observability tracks not just data content, but also the data pipelines, infrastructure, and downstream consumption to get a holistic picture of data health. In short, quality management asks “Is the data correct and useful?” while observability asks, “Is the entire data system functioning reliably?”.
- Primary Purpose: Data Quality processes are oriented toward remediation and improvement of data – identifying faulty data and fixing data issues at the source or through cleansing. The outcome is improved data accuracy and consistency. Data Observability is oriented toward monitoring, detection, and alerting – it acts as an early warning system that observes and flags anomalies in data pipelines as they happen. An observability tool might suggest possible fixes or provide diagnostics (e.g., “data freshness issue caused by pipeline X”), but it typically doesn’t directly correct the data; instead it enables teams to respond quickly. In other words, data quality tools help fix issues, whereas data observability tools help find issues (fast).
- Components & Techniques: Data Quality management relies on predefined rules, data validation checks, and transformation processes. It involves profiling data, defining quality criteria, and applying cleansing or enrichment. Common features include rule engines, data profiling utilities, master data management, etc. Data Observability relies on automated monitoring of telemetry (metrics, logs, data stats) across pipelines and databases. It uses techniques like anomaly detection, statistical monitoring, lineage tracing, and dashboarding to watch data in production. For example, an observability platform will monitor pillars like freshness, volume, distribution, schema, lineage continuously, whereas a data quality tool will enforce business rules for validity, accuracy, completeness, etc. during data processing. There is overlap (both might compute data profiling statistics or monitor data values), but their scope of automation vs. specification differs.
- Outcome & Use Cases: Data Quality efforts directly result in higher fidelity data – clean, standardized, error-free datasets. The business outcomes include more accurate analytics, compliance with regulatory standards (e.g., correct financial reporting), and reduced operational mistakes due to bad data. Data Observability efforts result in more reliable data delivery – reducing data downtimes and firefighting. The outcomes include faster incident resolution, prevention of broken pipelines or delayed reports, optimized performance (e.g., catching a heavy query that slows down the warehouse), and generally increased trust that “the data is flowing as it should.” Observability also often provides cross-system insight that pure data quality processes lack – for example, identifying that a dashboard error is due to an upstream ETL job failure, not just a data entry issue. In summary, data quality assures correctness, while data observability assures continuity and visibility. Both ultimately serve the shared outcome of “trusted, timely data” for the business, but through different immediate objectives.
It’s also worth noting that the two domains overlap in some technical capabilities. For instance, data profiling and data content monitoring (watching data for nulls, out-of-range values, etc.) are features of both data quality and observability solutions. This is why the terms can sometimes be confused. However, as highlighted by Gartner, “data quality and observability are very different concepts” with distinct focuses. Next, we’ll discuss how these disciplines complement each other when used together.
How Data Quality and Observability Reinforce Each Other
Rather than choosing one over the other, leading organizations are realizing that you need both data quality and data observability to achieve truly reliable, trustworthy data. When combined, these practices create a virtuous cycle: observability catches issues in real-time and provides insight into root causes, while data quality processes ensure those issues are resolved and prevented in the future. In complex, modern data stacks (with streaming data, cloud warehouses, AI models, etc.), the interplay between observability and quality is critical. Let’s explore a few ways they complement and strengthen each other:
Shared Goal: Trustworthy, Accurate Data
At the highest level, both data quality and data observability share the same ultimate goal – delivering trustworthy, accurate information to the business. They approach it from two sides: data quality initiatives aim to improve the intrinsic accuracy and completeness of the data, while observability aims to ensure the data remains reliable and available as it moves through systems. Together, they address both the correctness of the data and the reliability of the pipeline delivering it. This unified focus on “trusted data” aligns technical teams (data engineers, quality analysts, data scientists, etc.) with business stakeholders. Everyone can rally around metrics like a “data trust score” or data SLAs that encapsulate both quality and delivery reliability. In fact, Gartner suggests that maximizing value from data requires maximizing both data quality and data observability in tandem. When observability and quality are both in place, organizations can have confidence that data is not only correct in content but also arriving on time, every time, which is the foundation of robust, data-driven operations.
Real-Time Insight and Fast Reaction
One of the biggest advantages data observability adds to a data quality program is real-time visibility. Traditional data quality checks (like monthly data cleansing or post-load validations) might catch issues eventually, but by then damage can be done. Data observability brings continuous, real-time monitoring so that data teams get immediate insight into anomalies or pipeline failures. For example, if an upstream data feed starts dropping records or a schema change breaks a transformation, an observability tool like DQLabs will trigger an alert as soon as the anomaly is detected. This allows the team to react quickly – ideally before downstream consumers even notice the problem. The data quality discipline then kicks in to assess the impact and correct the faulty data (perhaps by backfilling missing data or adjusting a schema mapping). In other words, observability is the alarm system and diagnostics, while data quality provides the toolkit to actually fix the issue. This synergy drastically reduces “data downtime” – those periods when data is missing or incorrect. By responding in real-time, you prevent errors from lingering in reports or AI models. DQLabs, for instance, not only alerts you to anomalies but can also automate certain responses, using AI to suggest remediation steps or even auto-tune thresholds to reduce noise. The net effect is a more resilient data pipeline: issues are caught and addressed before they spiral into bigger problems, preserving the trust in your data.
Preventing Data Issues Before They Spread
Hand in hand with rapid detection is the ability to contain and prevent data issues from spreading across your data ecosystem. Data observability plays a preventative role: by continuously monitoring data at various points, it can catch issues at the earliest possible stage – for example, flagging a data anomaly in a source system or a staging table. Early catch means you can stop bad data from propagating downstream. Think of an observability platform noticing that a daily sales data file is only half the expected size; it can alert the data engineering team who then pauses dependent processes and requests a fix from the source before that bad data feeds into dashboards or machine learning features. This early interception saves costs and headaches. In fact, one noted benefit of adopting observability for data quality is cost savings by catching data anomalies before they impact consumers – the team can fix pipelines proactively, avoiding costly rework and preventing decision-makers from ever seeing flawed data. Data quality processes ensure that once the issue is isolated, it gets resolved properly (for instance, re-running the pipeline with the corrected data, or applying data cleansing rules to remove corrupt records). Moreover, observability often provides the context (lineage and impact analysis) to know which downstream systems or reports might be affected, so the quality team can focus their remediation efforts where it matters most. In short, observability + quality together create an environment of proactive prevention: issues are not only fixed, but systemically preempted from cascading further.
Pinpointing Root Causes to Preserve Data Integrity
Even with the best processes, data incidents will happen. When they do, the combination of observability and quality greatly aids root cause analysis and preservation of data integrity. Data observability provides rich metadata – lineage graphs, pipeline status, system logs, anomaly timelines – that help answer “what happened and why?”. For example, observability might reveal that a data integrity issue (say, a spike in invalid records) originated because an upstream data source changed its schema unexpectedly two hours ago. With this knowledge, the data quality team can target the root cause: perhaps updating the ETL mapping to accommodate the new schema and then cleaning the affected data. Without observability, teams often spend hours or days searching for the source of a data problem; with observability, they can pinpoint it in minutes by following the data lineage and anomaly signals. This rapid root cause identification is crucial to maintaining overall data integrity – it means fixes can be applied at the correct point in the process, ensuring the issue is truly resolved and not just patched over. Furthermore, data observability tools can provide AI-driven outage analysis on historical patterns, correlating events to suggest why a problem occurred. Meanwhile, data quality practices ensure that after the fix, the data is back to a trusted state (e.g., validating that all records are now accurate and consistent). For instance, once a broken pipeline is fixed, the data quality rules can be re-run on the dataset to confirm everything is within specification. In DQLabs, these capabilities come together: it can trace data lineage across sources and even automatically recommend solutions for certain issues, while its quality engine can then enforce the necessary rules to keep data accurate. This one-two punch of diagnosis and repair helps preserve the integrity of enterprise data even as issues arise.
Cross-Team Collaboration for Data Success
A perhaps under-appreciated benefit of combining data quality and observability is the cultural and collaboration impact. Traditionally, data quality has often been the realm of data stewards or quality analysts, while data observability (and incident monitoring) is handled by data engineers or site reliability engineers. When both aspects are unified (for example, in a single platform like DQLabs), it brings these teams together with a shared view of data health. Observability provides transparency that benefits not just IT ops, but also business-facing data teams. For example, a field-level lineage view from an observability tool can help a data analyst understand how an upstream issue led to a broken report – fostering greater empathy and collaboration between analysts and engineers. DQLabs notes that tracing lineage and dependencies improves collaboration, as each team can see how their data assets impact others. Additionally, having a unified dashboard for data reliability and quality status encourages a “data reliability ops” culture, where everyone from data engineers to BI developers works off the same metrics and alerts. Tools can integrate with communication platforms (like Slack or Microsoft Teams) and ticketing systems (like Jira) to ensure that when a data observability alert fires, both the technical team and the data owner/steward are notified simultaneously. This cross-functional response means issues are resolved faster and with all perspectives in the loop. Furthermore, embedding data quality scores and observability alerts into data catalogs (via DQLabs’ semantic layer integration, for instance) provides business users and data governors visibility into data health in their familiar tools. That encourages stakeholders outside IT to engage in the data quality process (e.g., a business analyst seeing a low quality score on a dataset in Collibra might raise a concern). Ultimately, combining observability and quality builds a culture of accountability and trust: data stewards know data quality is maintained, while data engineers have visibility into potential pipeline issues before they escalate. Everyone speaks the same “data trust” language, breaking down silos between those who manage data pipelines and those who manage data definitions.
Industry Examples: The reinforcement of observability and quality is valuable across industries:
- In AI/ML initiatives, high data quality ensures models are trained on correct, unbiased data, while observability monitors data pipelines and drift in model inputs, preventing model performance issues due to unseen data anomalies.
- In Finance, rigorous data quality (for accuracy in transactions, customer records, etc.) is mandated by compliance, and data observability ensures timely data feeds for reports – catching things like a delayed trading data update before it causes a reporting breach. Together, they protect against costly errors and regulatory penalties.
- In Healthcare, data quality (accuracy and completeness of patient data) can affect clinical decisions, and observability monitors the interfaces between systems (EMRs, labs, etc.) so that if a data feed fails or values start looking off (e.g., abnormal vital readings due to device error), it’s caught immediately. This safeguards patient care and data integrity.
- In Operations/Supply Chain, data quality makes sure inventory and logistics data is correct (preventing stockouts from erroneous records), while observability watches real-time data pipelines from IoT sensors or ERP systems. If a data flow from a sensor network goes down, observability alerts the ops team to fix it before it impacts production decisions. The combination leads to more resilient, efficient operations driven by trusted data.
“Data quality gives you accuracy. Data observability gives you reliability.
Together, they give you Data Trust!”
Frequently Asked Questions
Are data observability and data quality the same thing?
No – while they are related and often complementary, they are not the same. Data quality is about the state of the data itself (is it correct, complete, valid, etc.), whereas data observability is about the visibility into the data pipelines and systems that move data. Data quality focuses on content and typically involves fixing data issues, while data observability focuses on monitoring and detecting issues in real-time. Think of data quality as ensuring “data correctness,” and data observability as ensuring “data delivery and system health.” They overlap (for example, both might monitor for anomalies in data values), but each addresses different dimensions of trust.
Why do we need both data observability and data quality – can’t one of them suffice?
You need both because they address different failure modes in a data environment. Data quality tools ensure your data meets business-defined standards (catching issues like wrong values, duplicates, and missing fields), but they might not tell you why an issue happened or catch unforeseen problems. Data observability tools will catch things like pipeline failures, latency issues, or unexpected changes in data patterns in real-time, but on their own they don’t fix the data – they alert you to issues. If you only do quality, you might have clean data when loaded but miss that yesterday’s load didn’t run at all. If you only do observability, you might know a problem occurred but still be stuck with bad data until you manually clean it. Together, observability and quality ensure the prevention, detection, and correction of data issues. As Gartner has noted, organizations get the most value when they maximize both simultaneously. A unified approach reduces data incidents and ensures any issues that do slip through are swiftly detected and resolved.
How do data observability and data quality integrate with DataOps and data governance?
Data observability and quality are core components of a successful DataOps practice – they provide the monitoring, feedback, and control needed to manage data pipelines with the same rigor DevOps brings to software pipelines. In DataOps, observability ensures continuous data pipeline monitoring (so you treat data flow issues with an agile, quick-response mindset), and data quality provides the standards and testing framework (so you treat data validation similar to how DevOps treats automated testing). Together, they enable continuous improvement and deployment of reliable data. Regarding data governance, these tools operationalize governance policies: data quality rules are essentially governance standards (e.g., “these fields must be valid per policy”) being enforced, and observability provides the audit and lineage information that governance teams need (e.g., who accessed what data, where did data come from, what anomalies occurred). Integrations with governance tools like Collibra or Atlan allow observability/quality metrics to feed into data catalogs, enhancing the governance oversight. So, observability and quality can be seen as the practical enforcement arms of governance and the enablers of DataOps, ensuring governance isn’t just theoretical and DataOps isn’t blind to data issues.
What is the role of AI and automation in data observability and quality (for example, in DQLabs)?
AI is becoming a game-changer in both fields by automating what used to be manual. In data quality, AI can profile data and automatically detect anomalies or suggest data cleaning steps (for instance, identifying that a column of free-form text is actually social security numbers, and flagging those that don’t fit the pattern). It can also learn from past issues to recommend new quality rules (DQLabs’ semantic engine does a lot of this – auto-discovering data relationships and proposing rules without manual coding). In data observability, AI/ML algorithms establish baselines of normal behavior (seasonal trends, correlations between metrics, etc.) so they can highlight subtle anomalies that static thresholds would miss. This drastically cuts down on false alerts – e.g., the platform won’t alert for a minor blip that it knows is within normal variance, but will alert for a truly unusual pattern. AI can also help with root cause analysis (clustering related anomalies, pinpointing likely causes) and even with incident resolution – for example, suggesting that “restart pipeline X” or “revert the last deploy” could fix an issue, based on historical learnings. DQLabs is an AI-driven and semantics-powered platform that uses AI to understand the meaning of data, not just the raw values, and operate autonomously through self-tuning and auto-remediation suggestions. The benefit is that a lot of heavy lifting is taken off your team: fewer manual rules to write, fewer thresholds to set, and faster detection of complex issues that humans might not catch in time. As data ecosystems continue to scale, this kind of automation is crucial to keep up with volume, velocity, and variety in data.
Can one platform really handle both data quality and data observability effectively?
Yes, several modern platforms are designed to do both, and this unified approach is increasingly popular. DQLabs is one example of a platform that was historically focused on data quality but now includes full data observability features in a single solution. Similarly, some data observability vendors are adding data quality capabilities. The advantage of one platform is a seamless experience: you get a single dashboard, unified metadata, and avoid the integration challenges of stitching together separate tools. For instance, in DQLabs, the “Observe” module (for unknown issues) and the “Measure” module (for known data quality checks) are part of the same workflow. The platform can automatically take an observability finding (like an anomaly) and feed it into the quality context (like updating a quality score), and vice versa. You also only need to integrate your data sources once to cover both needs. That said, the efficacy depends on the platform’s maturity – DQLabs has invested in both areas, as evidenced by its recognition in Gartner’s Data Quality Solutions Magic Quadrant and inclusion in data observability market guides. When evaluating a unified platform, ensure it truly has depth in both domains (check for features like robust rule management and advanced anomaly detection, etc.). If a single platform meets your requirements, it can greatly simplify deployment and yield a single source of truth for data reliability. Many organizations find this preferable to juggling separate siloed tools for quality and observability. Of course, what matters most is that all capabilities are covered – in some cases, if one tool is best-of-breed for quality and another for observability, integration is possible. But with solutions like DQLabs available, it’s now quite feasible to get the best of both worlds in one package without compromise.