
The 5 Types of Data Observability and Data Quality Metrics You Need in 2026
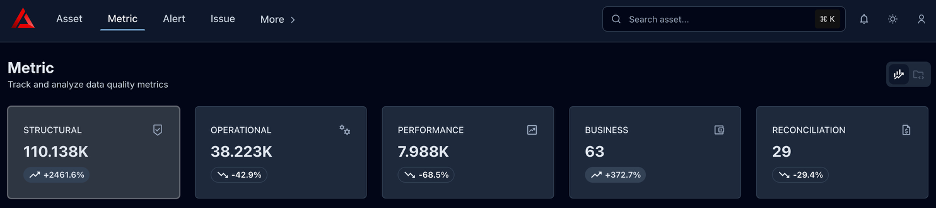
Data observability and data quality metrics are measurable indicators used to determine whether data is reliable and fit for use. They measure attributes such as freshness, volume, structure, validity, consistency and business-rule compliance. PRIZM organizes these metrics into five contexts: Operational, Performance, Structural, Business and Reconciliation.
What You’ll Learn
- Learn which data quality metrics matter, what they measure, and when to use them.
Key Takeaways
- Data quality metrics are not one flat list. In PRIZM, every metric belongs to one of five contexts — Operational, Performance, Structural, Business, and Reconciliation — and the context determines who the metric serves and what question it answers.
- Three of those five contexts are auto-generated. Operational and Performance metrics appear the moment a source is connected; Structural metrics are produced automatically when an asset is profiled. Business and Reconciliation metrics are defined as per business and governance requirements.
- Every metric carries two independent settings — Monitor (does this raise an alert?) and Score (does this move the trust score?). Keeping observability separate from scoring is what stops a slow warehouse from dragging down a table’s quality score.
- Thresholds are a separate decision from metric type. PRIZM supports Auto (statistical baseline), Limit (fixed bound), and Custom (multiple named criteria with their own priorities and actions).
- Anomaly detection is self-tuning. PRIZM builds a baseline from historical runs, expresses deviation as a drift score in standard deviations, and maps drift magnitude to Low/Medium/High/Critical priority bands.
- Metric health is not pass/fail. Priority weights recent alerts more heavily than older ones and resolves into one of four states: Healthy, Stable, Degrading, or Critical.
Quick answer
What are the five types of data quality metrics?
The five metric types, as implemented in PRIZM, are:
Why metric count is the wrong question
Most data quality programs start by asking how many checks they have. It is the wrong number to optimize. The problem is classification, not quantity. A row-count drop and a regex violation are both quality failures, but they need different owners, response times, and consequences. One should notify a data engineer at 2am. The other should appear in a weekly steward review and quietly reduce an attribute score. Stored in the same undifferentiated list of “rules,” the platform cannot make that distinction — and neither can the person on call.
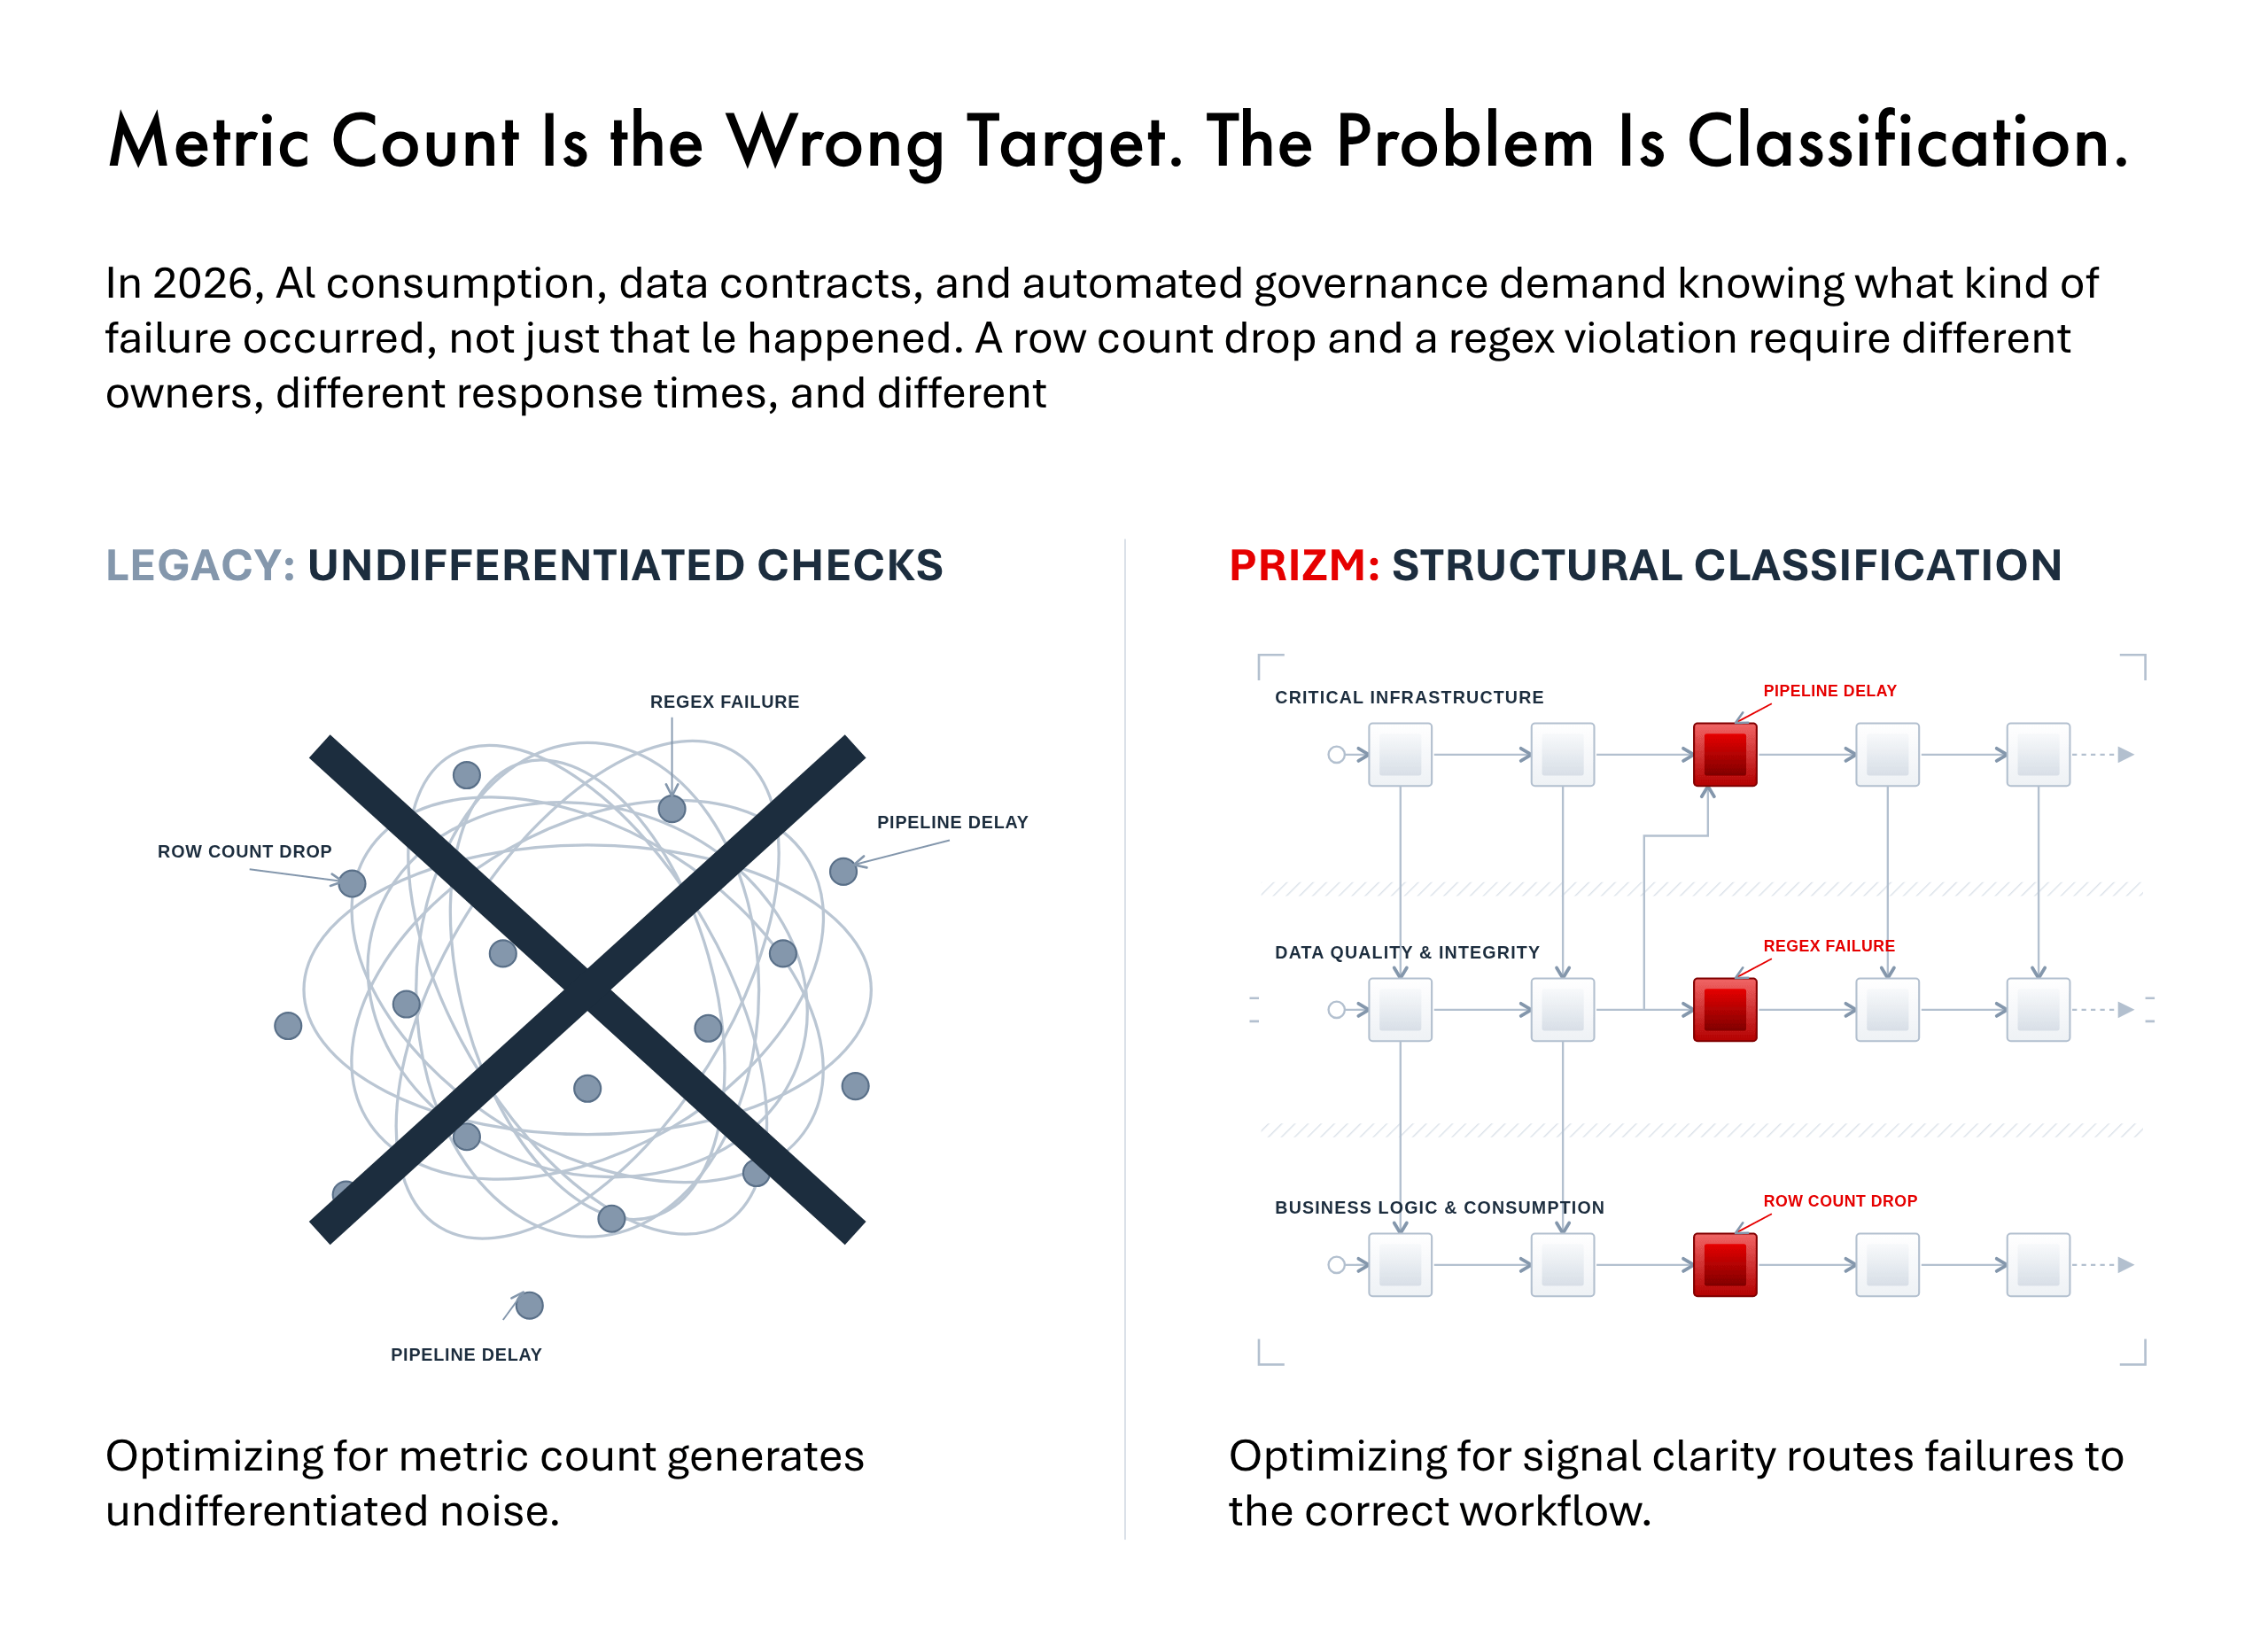
This matters more in 2026 than it did three years ago. Data products carry contracts. AI systems consume tables directly, without a human noticing the numbers look wrong first. Governance teams are being asked to certify assets, not just document them. Each of those obligations depends on knowing what kind of failure occurred, which means the metric model has to encode that distinction from the start.
PRIZM handles this by giving every metric a context: a stakeholder lens that fixes who the metric serves, at what level of the estate it runs, and what happens when it fails.
How PRIZM classifies data quality metrics
PRIZM classifies metrics along three axes at once. Understanding all three is what makes the model usable.
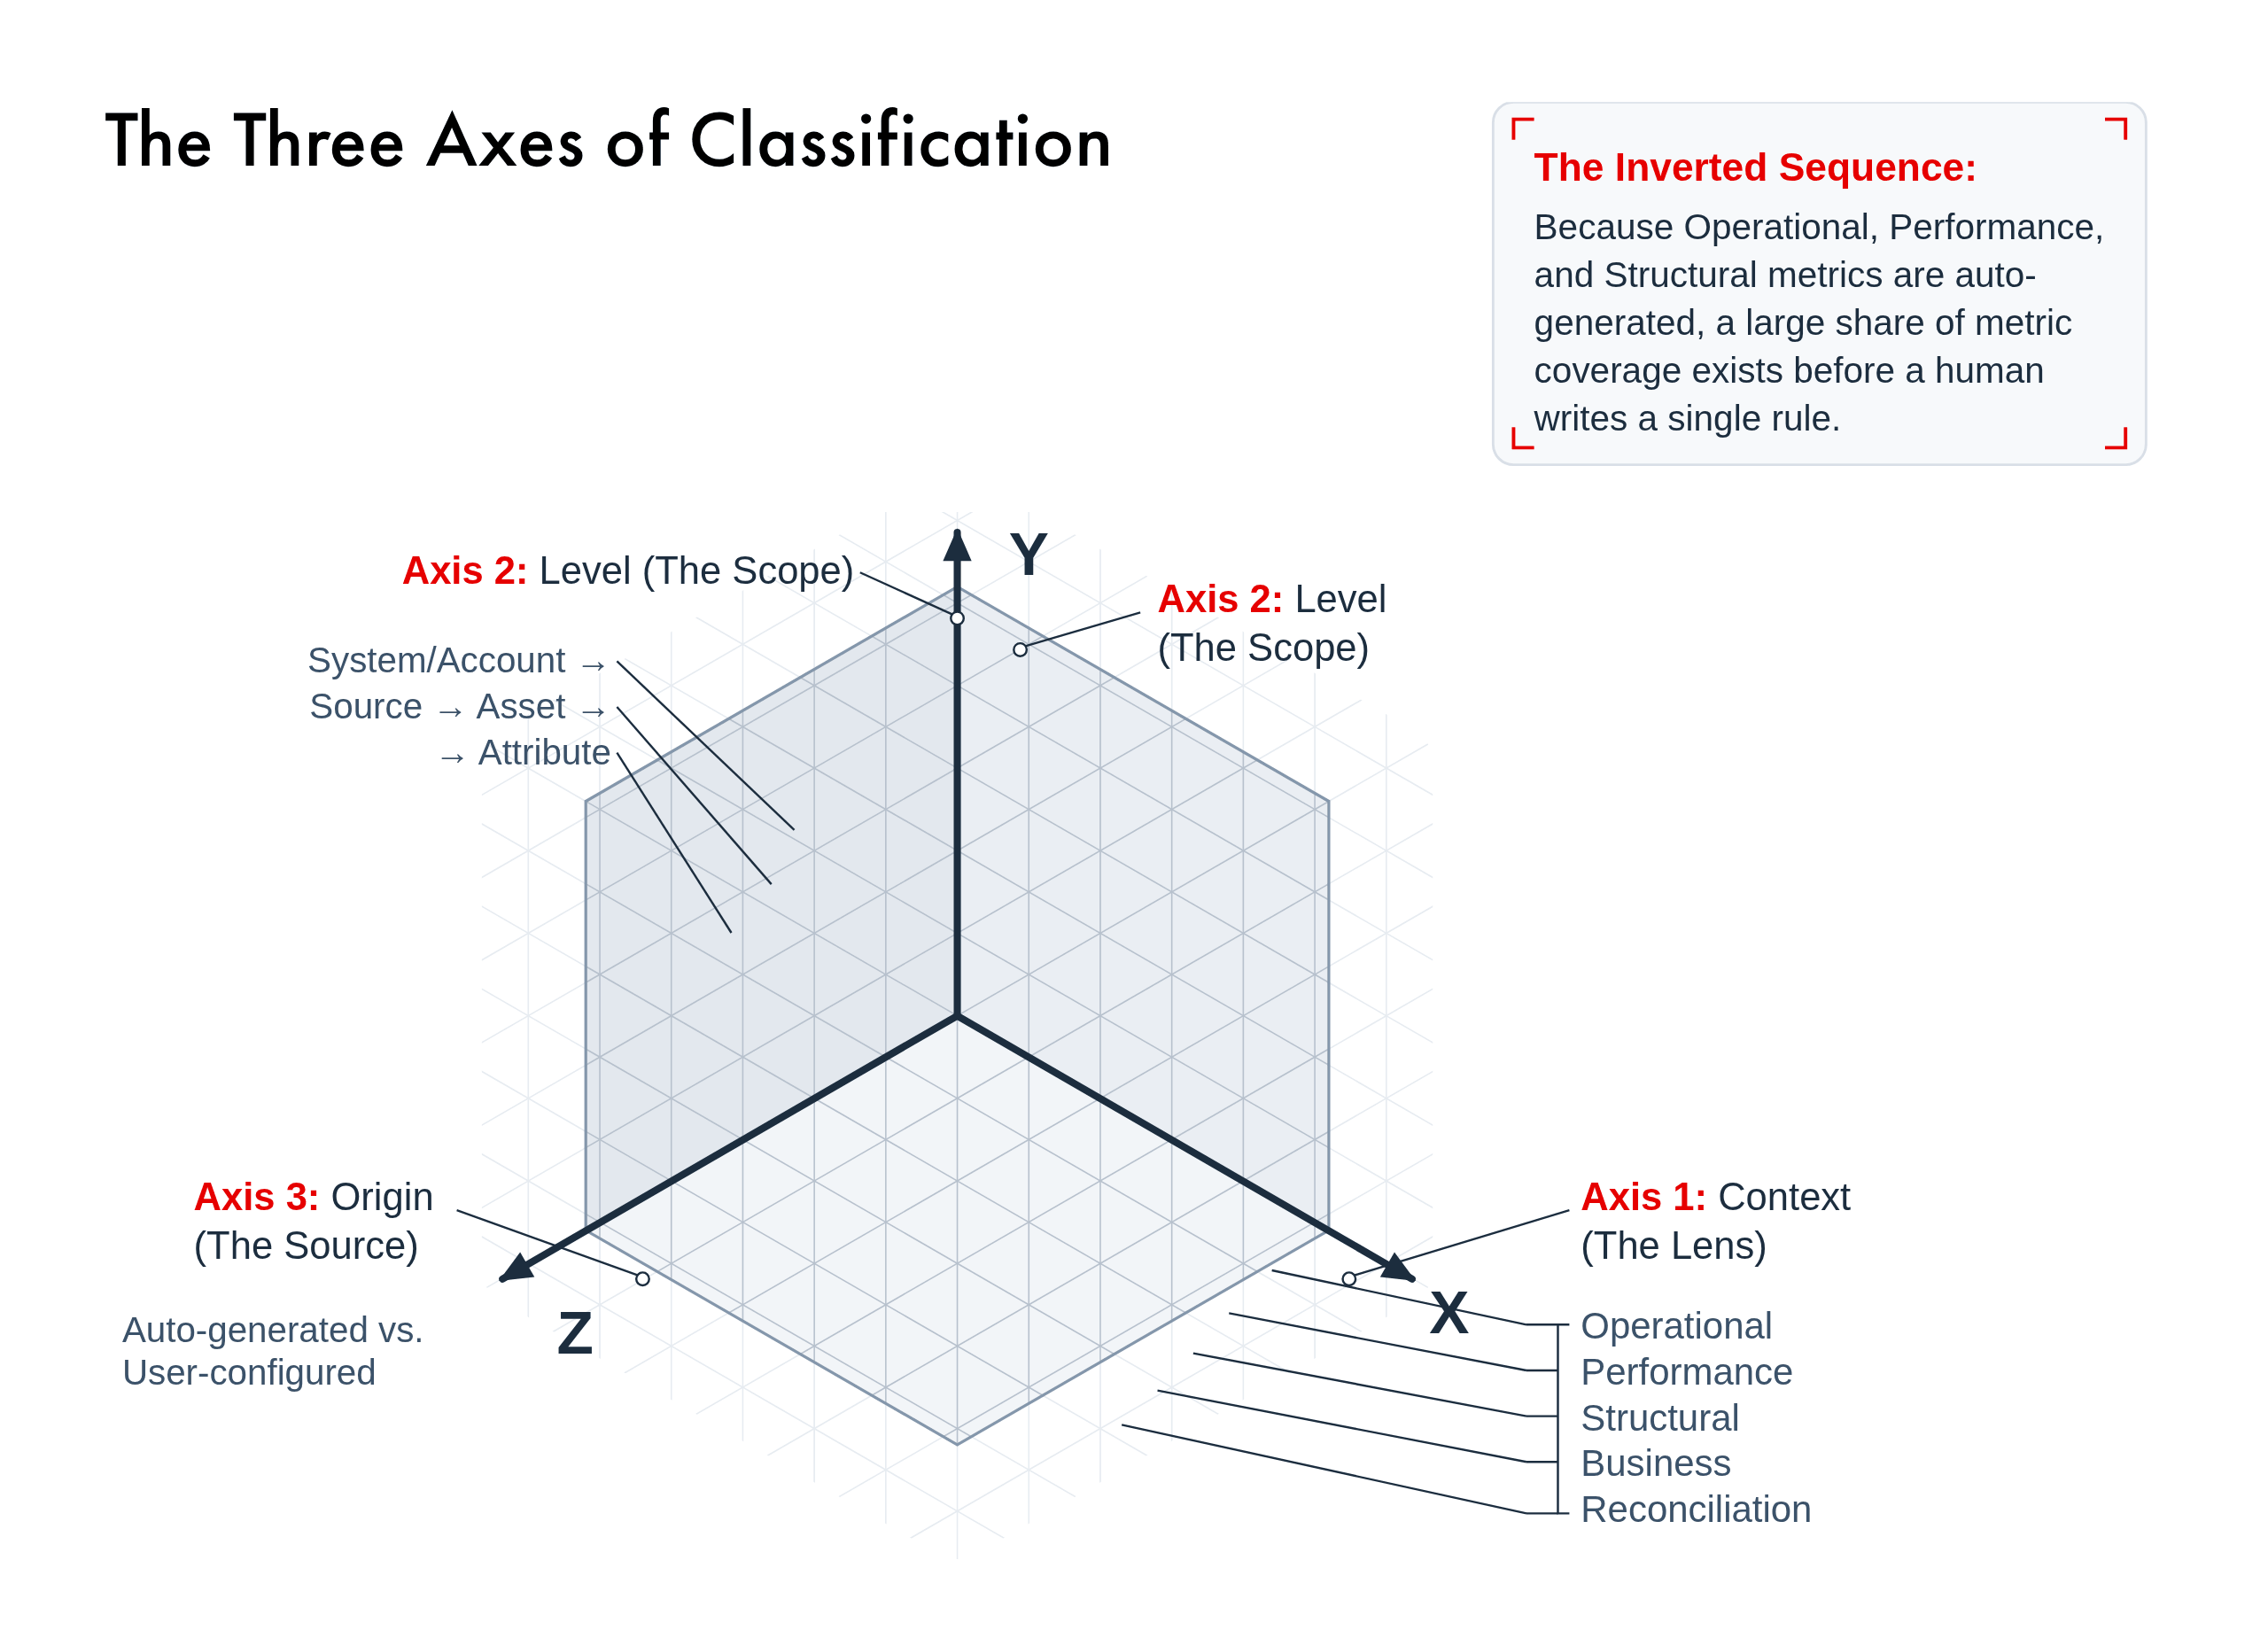
- Axis 1 — Context. The stakeholder lens. Five values: Operational, Performance, Structural, Business, Reconciliation.
- Axis 2 — Origin. Whether the metric is auto-generated or user-configured. Operational and Performance metrics are generated after an asset or warehouse is connected. Structural metrics are generated automatically when an asset is profiled. Business and Reconciliation metrics are created by people — analysts, engineers, domain SMEs — because they encode specific business checks.
- Axis 3 — Level. Where the metric runs. Operational metrics run at the Asset level. Performance metrics run at the Source and System level (Warehouse, Database, Account). Structural metrics run at the Attribute (column) level. Business metrics run at the asset or, for Standalone, the domain or organization level.
| Context | Origin | Level | Primary consumer |
|---|---|---|---|
| Operational | Auto-generated | Asset | Data Engineering, DevOps |
| Performance | Auto-generated | Warehouse, Database, Account | Data Engineering, Platform and infrastructure teams |
| Structural | Auto-generated on profile | Attribute (column) | Data stewards, analysts |
| Business | User-configured | Attribute /Asset / Domain / Org | Domain SMEs, analysts, governance |
| Reconciliation | User-configured | Cross-asset | Finance, compliance, ETL owners |
The practical consequence of the origin axis is worth stating plainly: a large share of your metric coverage exists before anyone writes a rule. Structural metrics alone are the largest context in PRIZM. That inverts the usual sequencing — instead of starting from zero and building rules until coverage feels adequate, teams start from broad automated coverage and add user-defined metrics only where business judgment is genuinely required.
Type 1
Operational metrics
Operational metrics monitor the day-to-day health of data assets: whether data is arriving on time, in the expected volume, and with the correct structure. They run at the asset level, all carry Monitor: Yes, and they are the primary driver of alerting and anomaly detection in PRIZM.
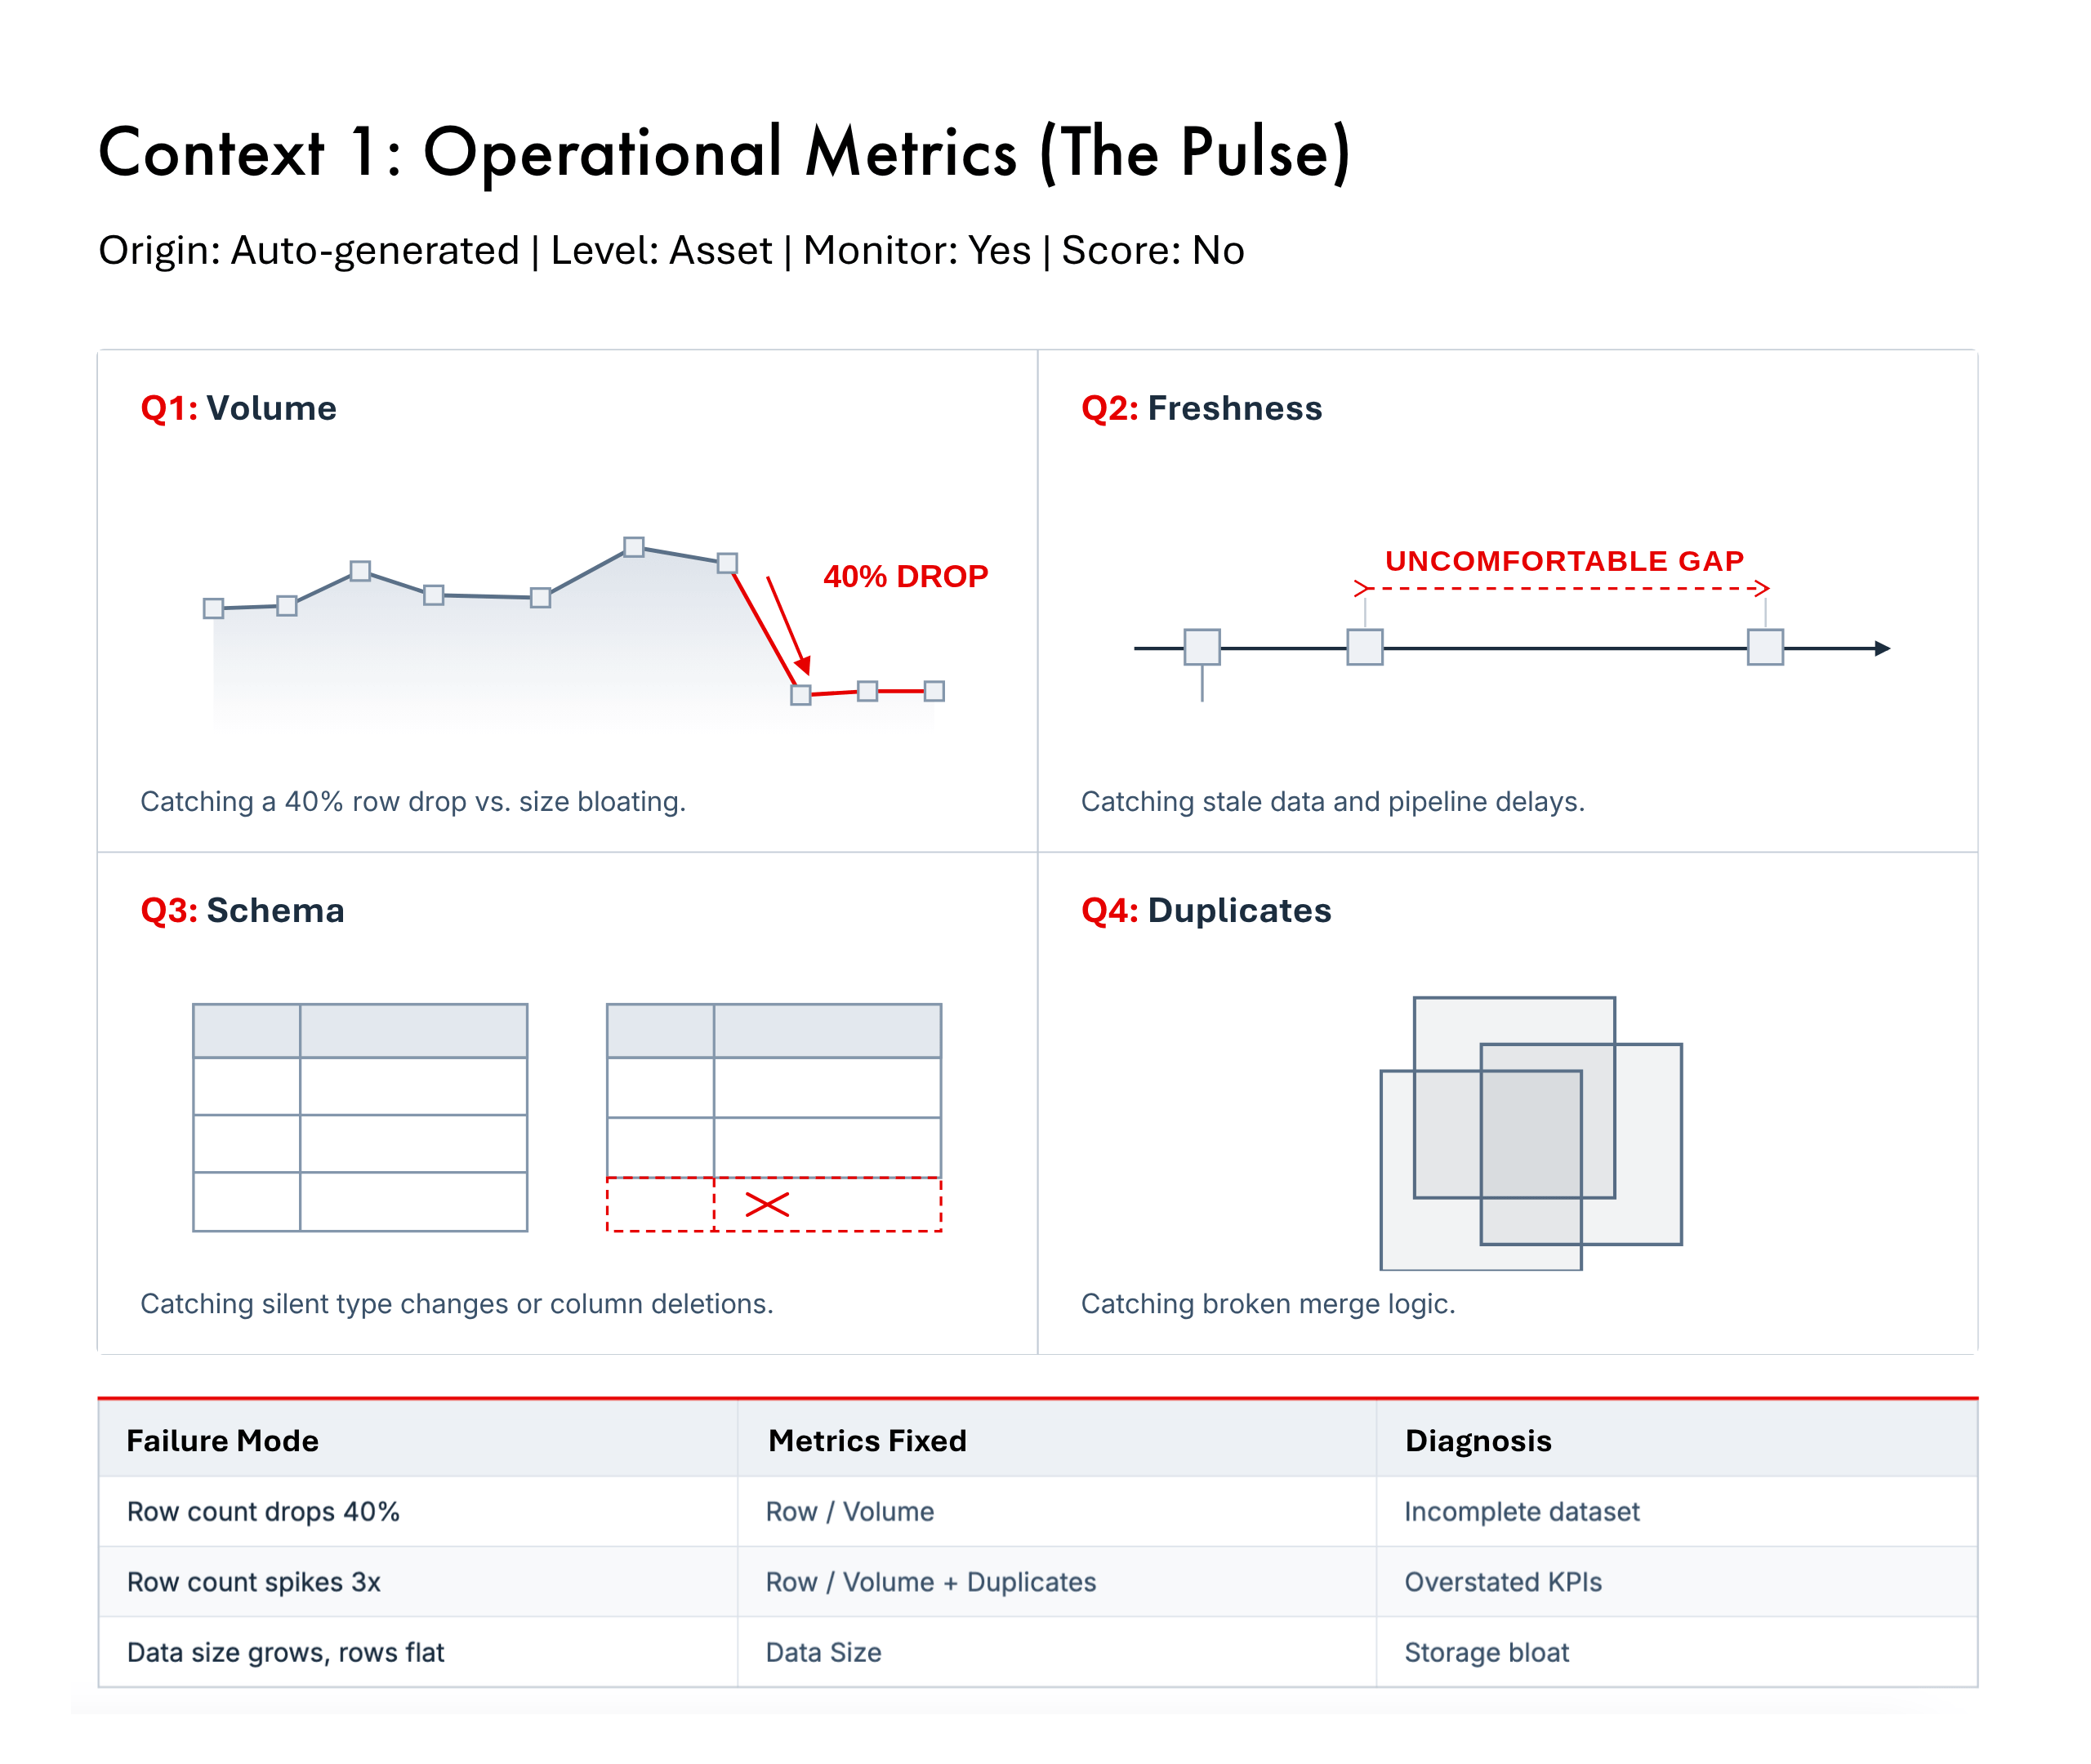
They break into four subcategories:
- Volume — how much data exists in an asset: row count, data size, and absolute volume over time.
- Freshness — how recently data was loaded or updated. Detects stale datasets and pipeline delays before they reach consumers.
- Schema — column presence, data types, and schema drift. Catches breaking changes at the source.
- Duplicate — the count of duplicate rows based on a defined key or all columns.
| Metric | Subcategory | Dimension | What it catches |
|---|---|---|---|
| Row | Volume | Completeness | Row counts dropping or spiking unexpectedly |
| Volume | Volume | Completeness | Significant change in the amount of data arriving |
| Data size | Volume | Completeness | Size growth without row growth — wide or bloated records |
| Freshness | Freshness | Availability | Data not refreshed within the expected window |
| Last updated | Freshness | Timeliness | Pipelines not running on schedule |
| Column | Schema | Validity | Column additions or removals without a formal migration |
| Schema | Schema | Validity | Column name or type changes that silently break transformations |
| Schema name | Schema | Validity | Schema or namespace renames that break hard-coded references |
| Duplicates | Duplicate | Uniqueness | Pipeline re-runs without deduplication, broken merge logic |
What this looks like in practice. Consider a nightly load into an orders table. Four distinct failure modes produce four distinct signals:
| What happened | Metric that catches it | Business impact if missed |
|---|---|---|
| Row count drops to zero | Row / Volume | Dashboards show no data; analysts decide on empty reports |
| Row count drops 40% vs. prior run | Row / Volume | Analysis runs on an incomplete dataset; aggregates understated |
| Row count spikes 3× vs. prior run | Row / Volume + Duplicates | Metrics inflated; financial totals and KPIs overstated |
| Data size grows with no row increase | Data size | Storage costs rise; downstream ETL may time out or fail |
A single “row count check” would catch the first three and misclassify all of them as the same event. Separating volume, size, and duplicate signals is what makes the alert actionable rather than just true.
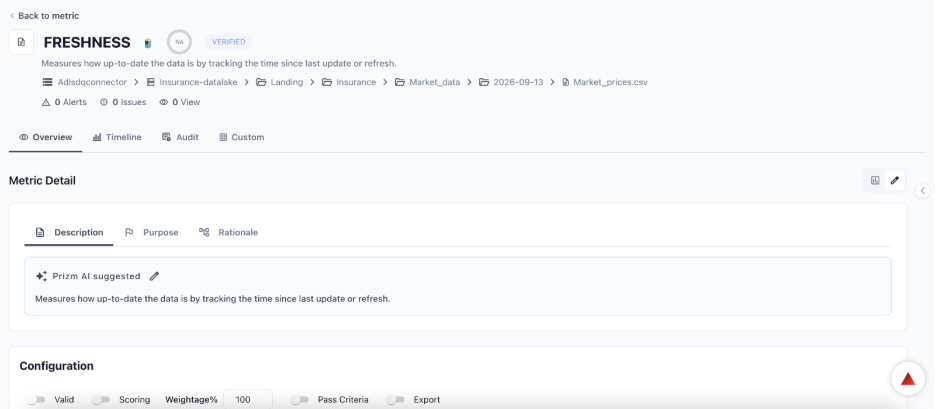
Operational metrics are active on every connected asset — no configuration required to start monitoring.
Type 2
Performance metrics
Performance metrics measure how efficiently the data platform itself is running: query execution time, compute utilization, job duration, and credit consumption. Unlike every other context, they operate at the Source and System level — Warehouse, Database, Account — rather than on individual assets.
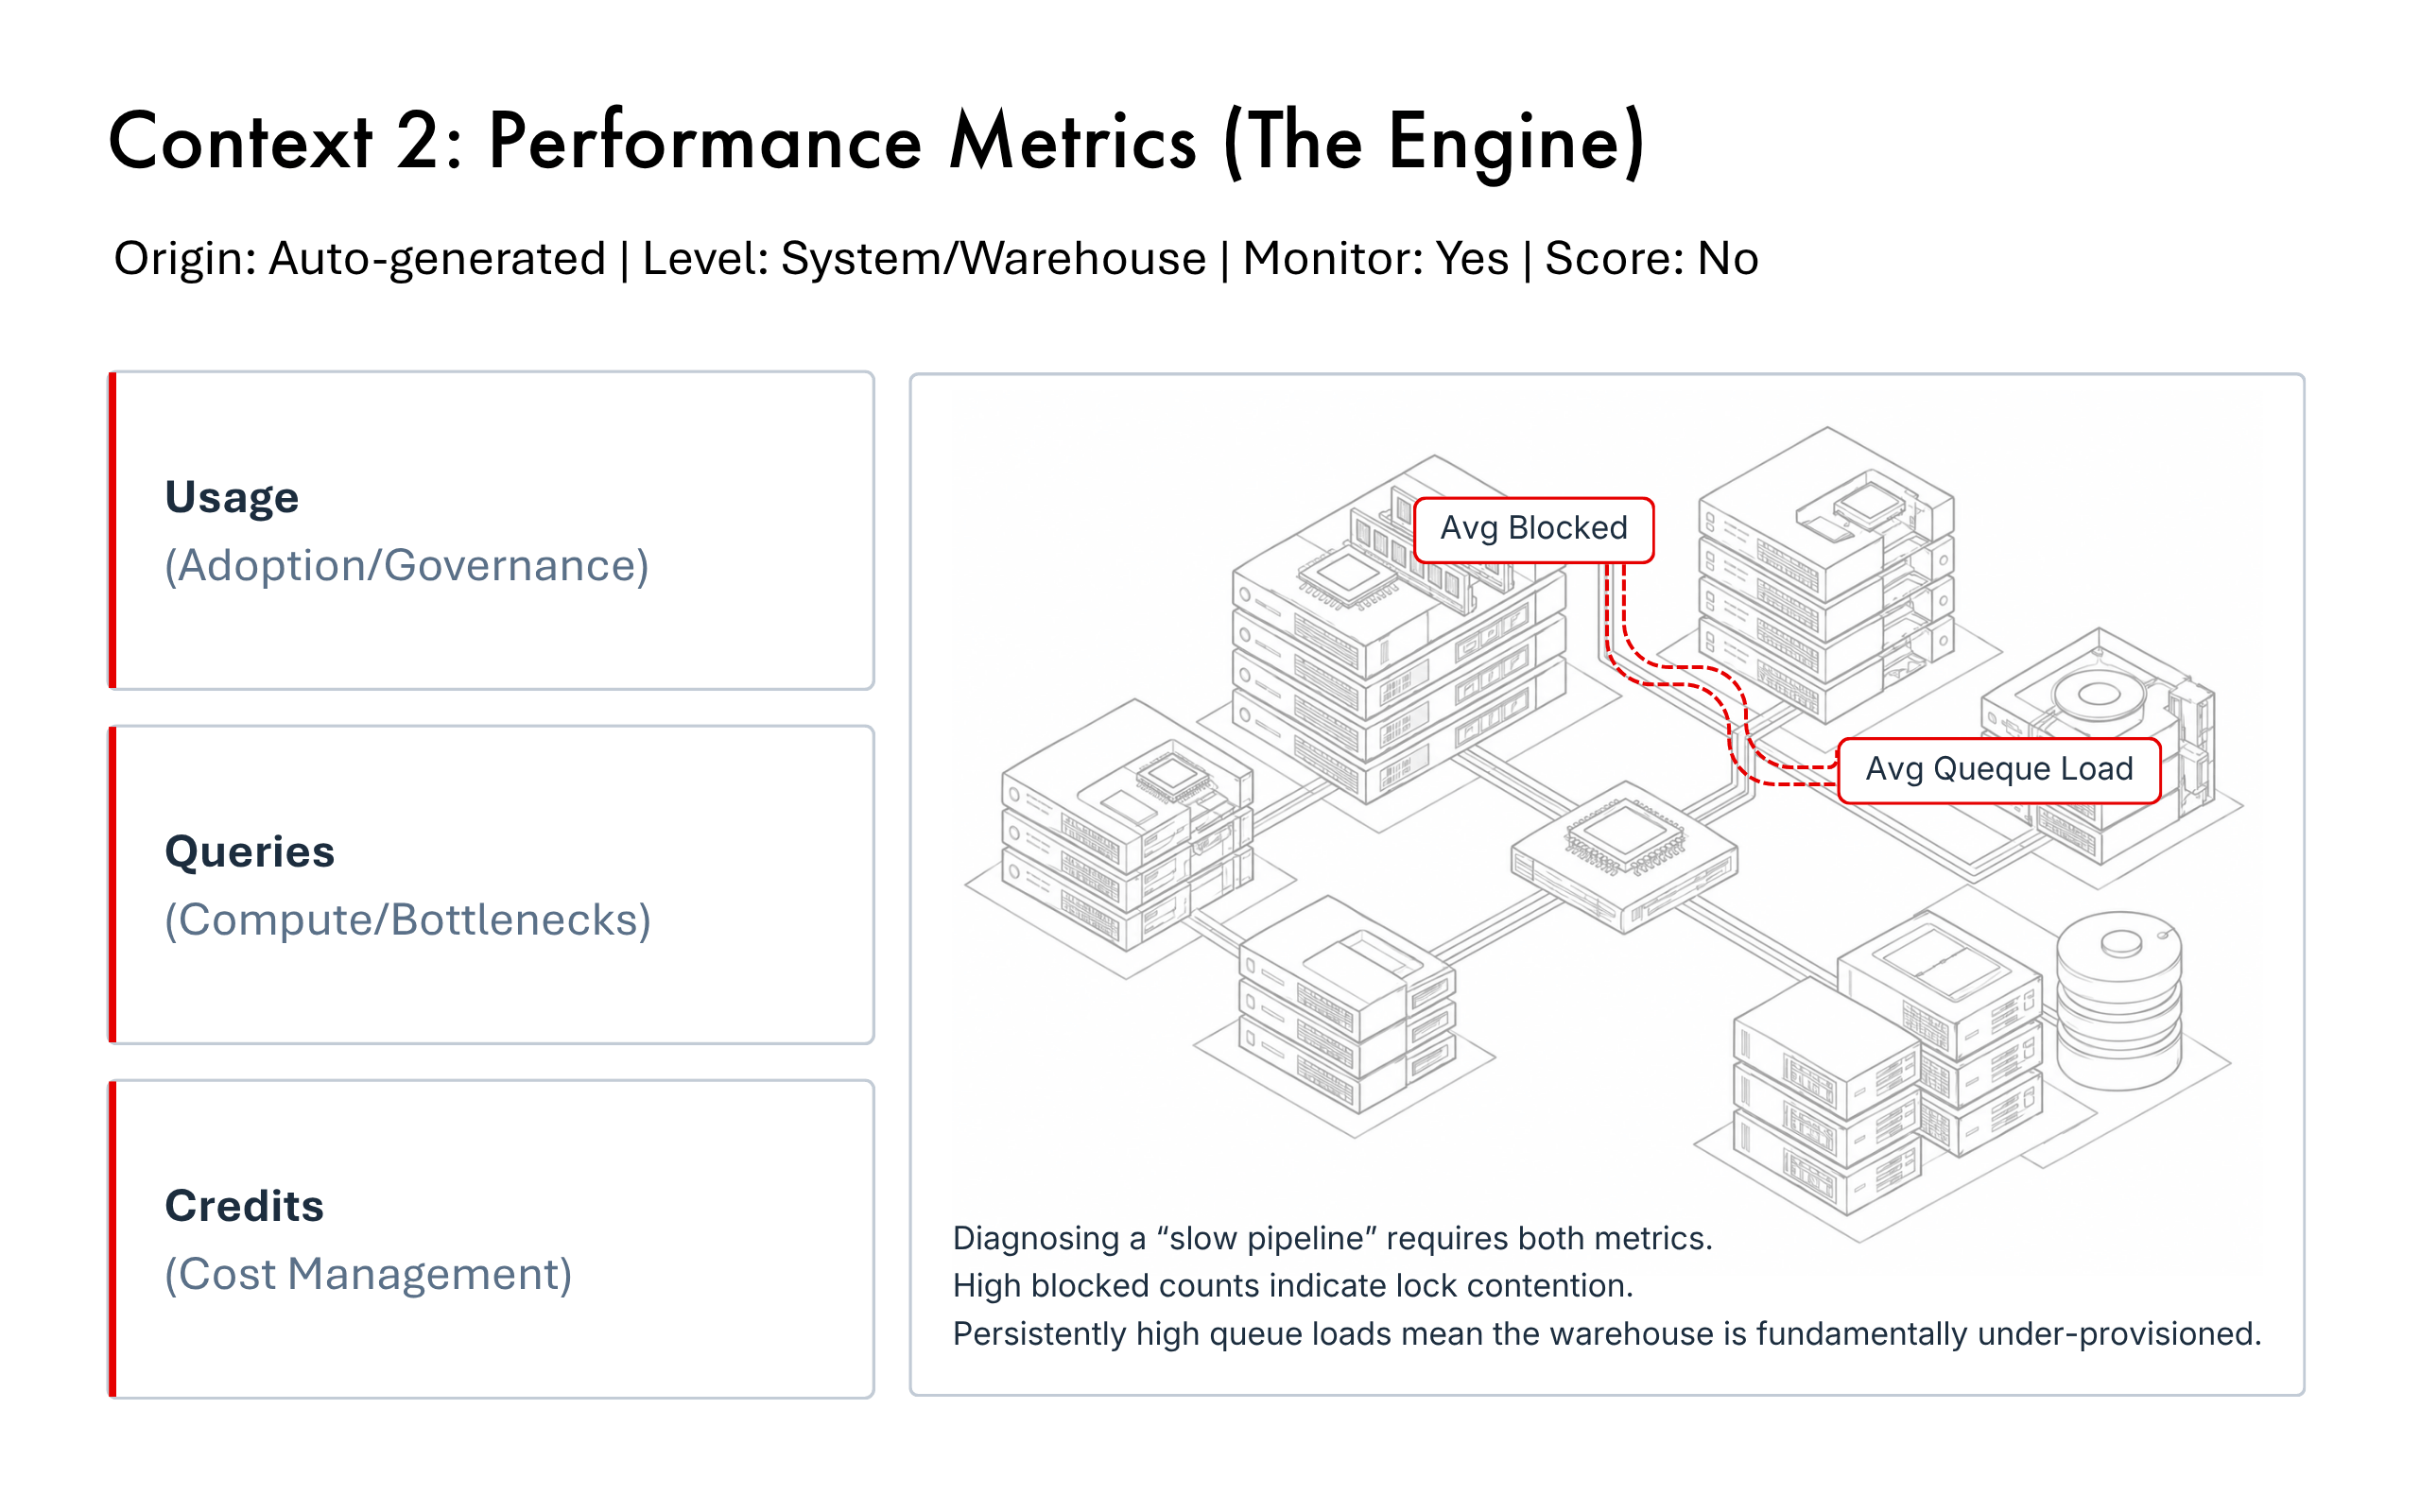
Three subcategories:
- Usage — who is querying data assets, how frequently, and with what success rate. Useful for adoption tracking and access governance.
- Queries — execution time, job duration, blocked queries, throughput. Identifies slow pipelines and compute bottlenecks.
- Credits — compute credit consumption at the warehouse and database level, for cloud cost management and chargeback.
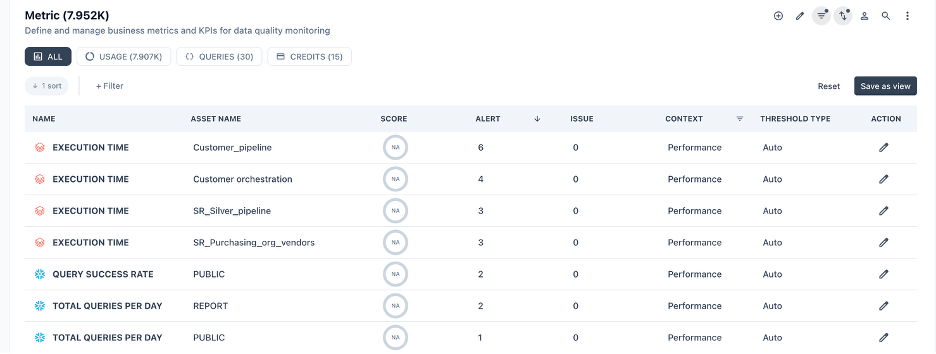
Representative metrics include Total queries per day, Query success rate, Execution time, Job duration, Test execution time, Avg blocked, Avg queue load, Avg running, Database storage, Total credits per day, and Credits used.
Two deserve a closer read. Avg blocked and Avg queue load together give a full picture of warehouse concurrency: high blocked counts indicate lock contention or long-running transactions, while a persistently high queue load means the warehouse is under-provisioned for the workload. Diagnosing “the pipeline is slow” without both numbers usually leads to the wrong remediation. Test execution time tracks whether quality test runtime is growing as asset counts increase — the failure mode where a quality initiative succeeds at coverage and then starts delaying pipeline signoff.
Type 3
Structural metrics
Structural metrics profile the internal shape of data at the column level. They answer: what does this data actually look like — how are values distributed, how often do patterns repeat, what do the numbers say, and what structural templates exist?
This is the largest context in PRIZM, and every metric in it is auto-generated: they run when an asset is profiled and require no user configuration. Structural metrics are also the primary input to trust scoring at the attribute level.
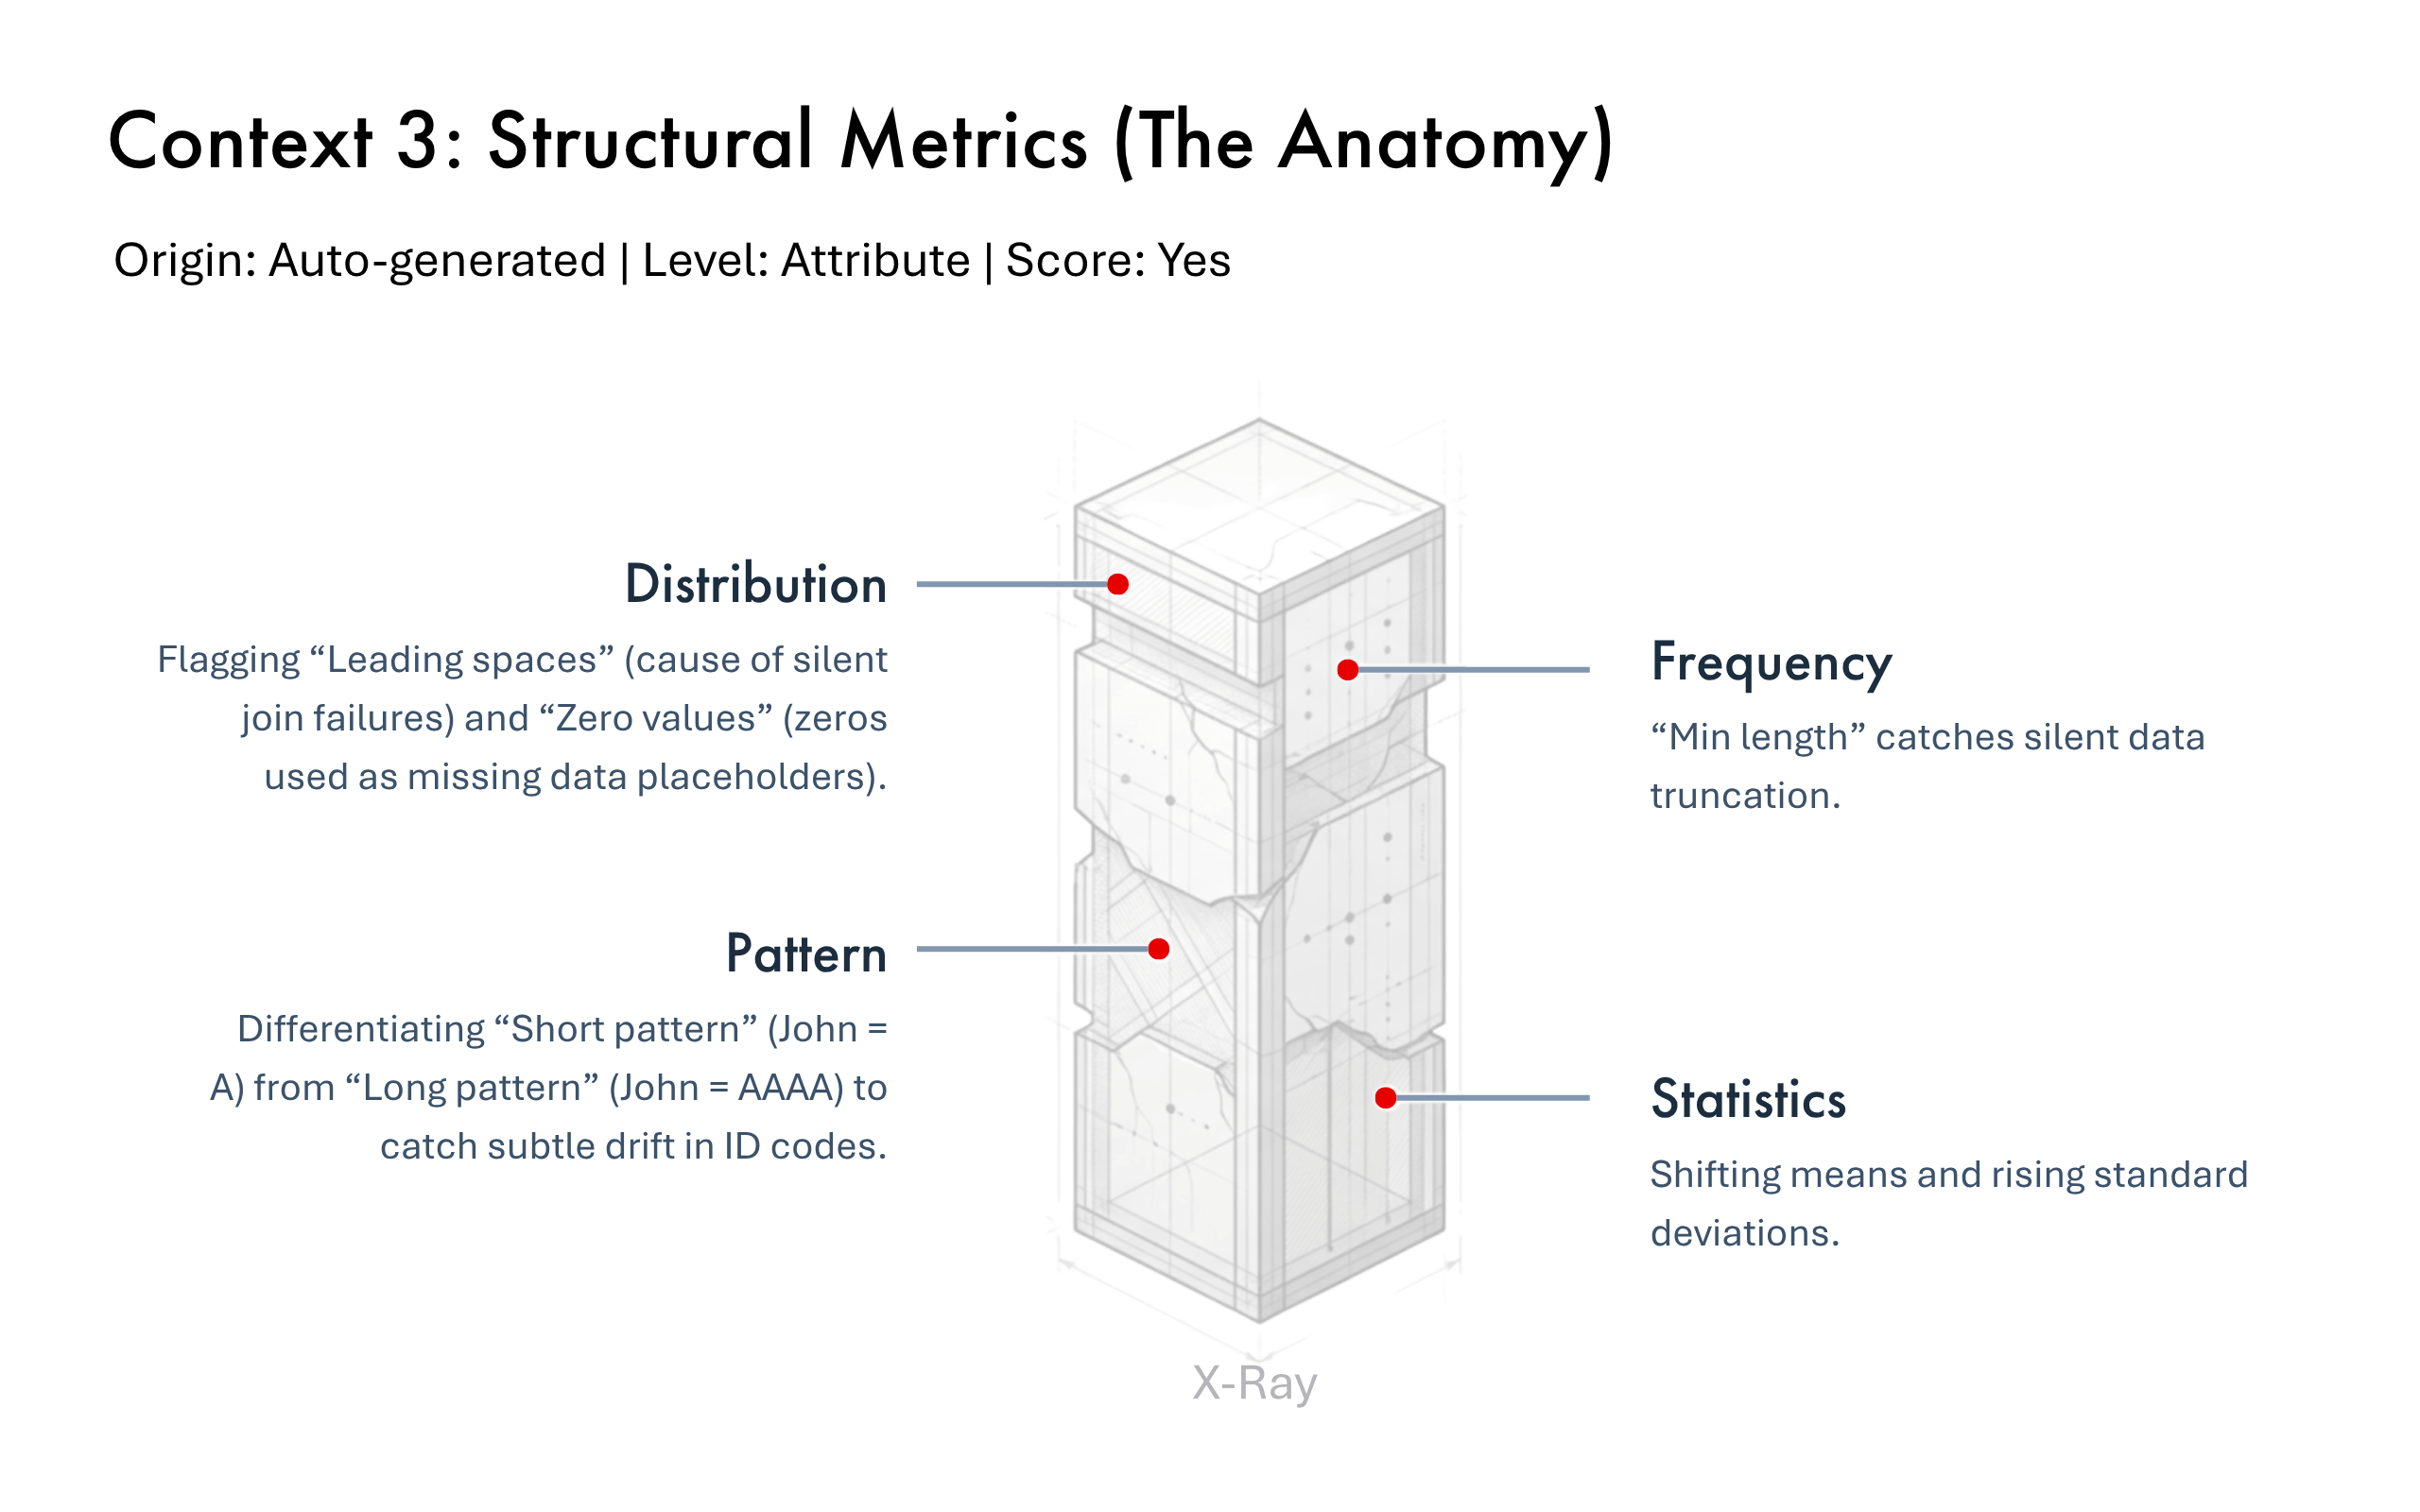
Four subcategories:
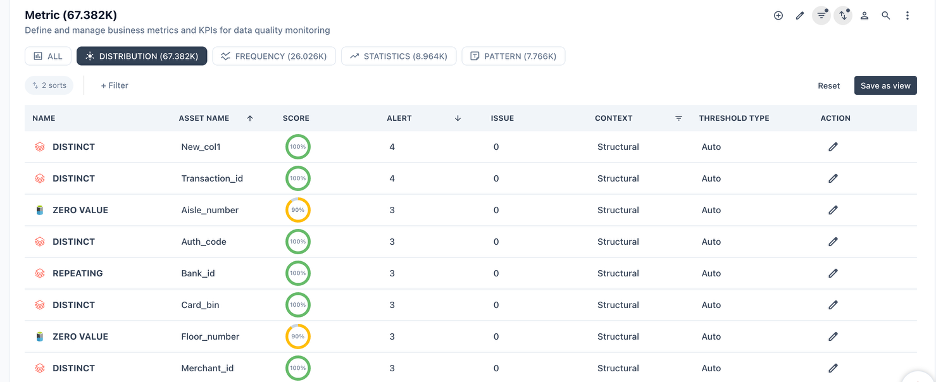
Distribution
How values inside a column are composed and spread. How many nulls, how many distinct, are there leading spaces, are there unexpected special characters.
Metrics include Null count, Empty, Non-empty, Space, Zero value, Distinct, Repeating, Leading/Trailing/Inner/Outer space, Whitespace, Character, Alpha numeric, Digit, Special character, Alphabet, Positive, and Negative — mapped to the Completeness, Uniqueness, and Validity dimensions.
Several catch failures invisible in a normal query. Leading space and Trailing space are a frequent cause of silent join failures. Zero value flags columns where zero is functioning as a placeholder for missing data rather than a real measurement — a distinction that quietly corrupts averages. Empty is deliberately separate from Null count: a value can be present and still carry no meaningful content.
Frequency
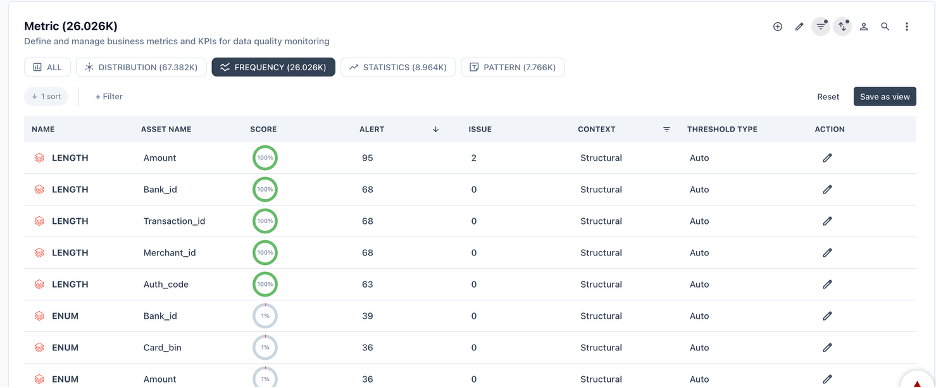
How often specific values, formats, and lengths appear. Enum, Min value, Max value, Value range, Min length, Max length, Length, and Length range.
Enum is effectively a value histogram, flagging values outside an expected allowed list. Value range is a strong drift signal: a sudden change in the min-to-max spread usually indicates pipeline contamination rather than genuine business change. Min length catches truncation — the failure that passes every null check and still breaks downstream systems.
Pattern
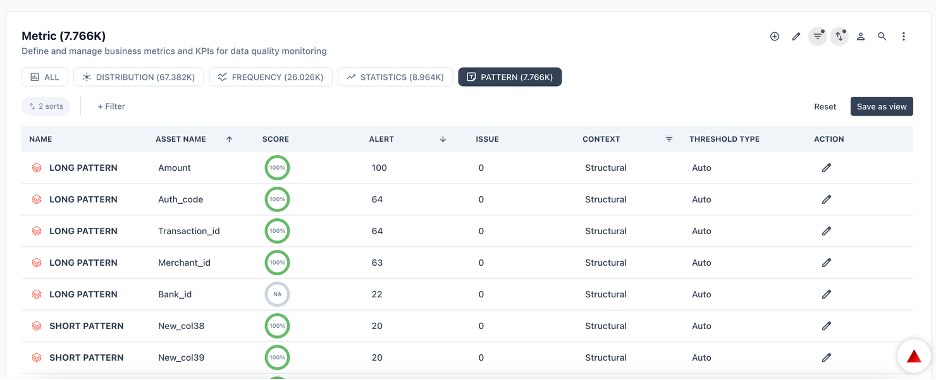
The structural template of values in a column — the repeating format that emerges from the data itself. PRIZM auto-discovers patterns by analyzing the character composition of each value (letters, digits, special characters) and grouping them into short and long representations. You can also define your own using regular expressions.
- Short pattern collapses consecutive identical character types into a single token — “John” becomes
A. Use it for a quick high-level view of format variety. - Long pattern preserves full length and composition — “John” becomes
AAAA. Use it to detect subtle length or composition changes, such as a country code column that sometimes contains a three-character value instead of two. - Regular expressions apply user-defined regex to validate known formats — email addresses, phone numbers, custom ID formats.
Short and long patterns are complementary rather than redundant. Pattern drift on ID and code columns is one of the earliest observable signs that an upstream system changed its output format.
Statistics
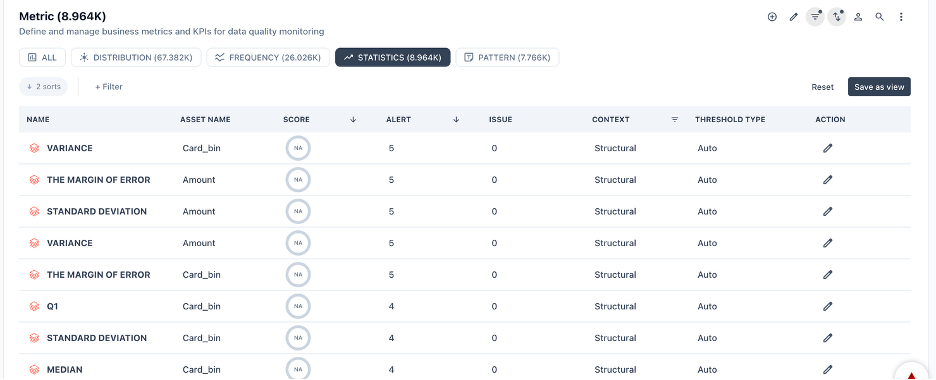
Numeric summaries applied to numeric and date columns: Mean, Median, Mode, Standard deviation, Sum, Q1, Q3, Range, Skewness, Kurtosis, Variance, and margin of error.
A shift in the mean is one of the earliest signals of data drift. A rising standard deviation indicates increasing variability, often a sign of degradation before any individual value looks wrong. A sudden change in mode can indicate a default value being injected into the pipeline.
Type 4
Business metrics
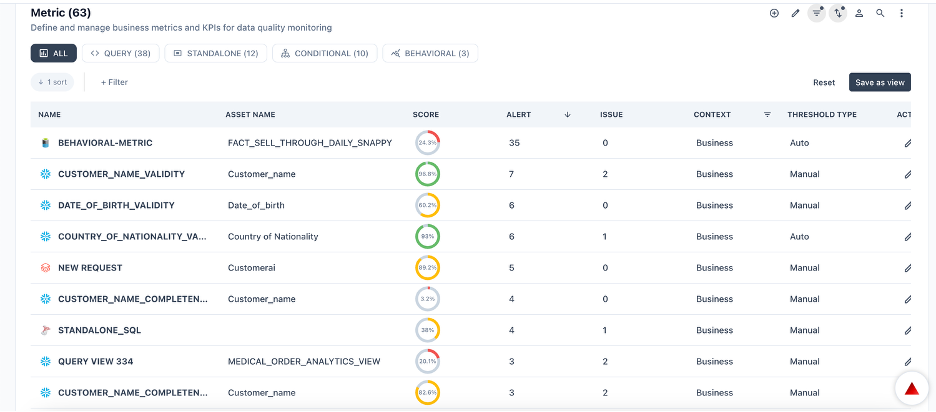
Business metrics are user-defined measurements aligned to domain rules, KPIs, and data contracts. Auto-generated structural and operational metrics give broad coverage of data shape and pipeline health, but they cannot know your business rules. Business metrics are where that knowledge lives.
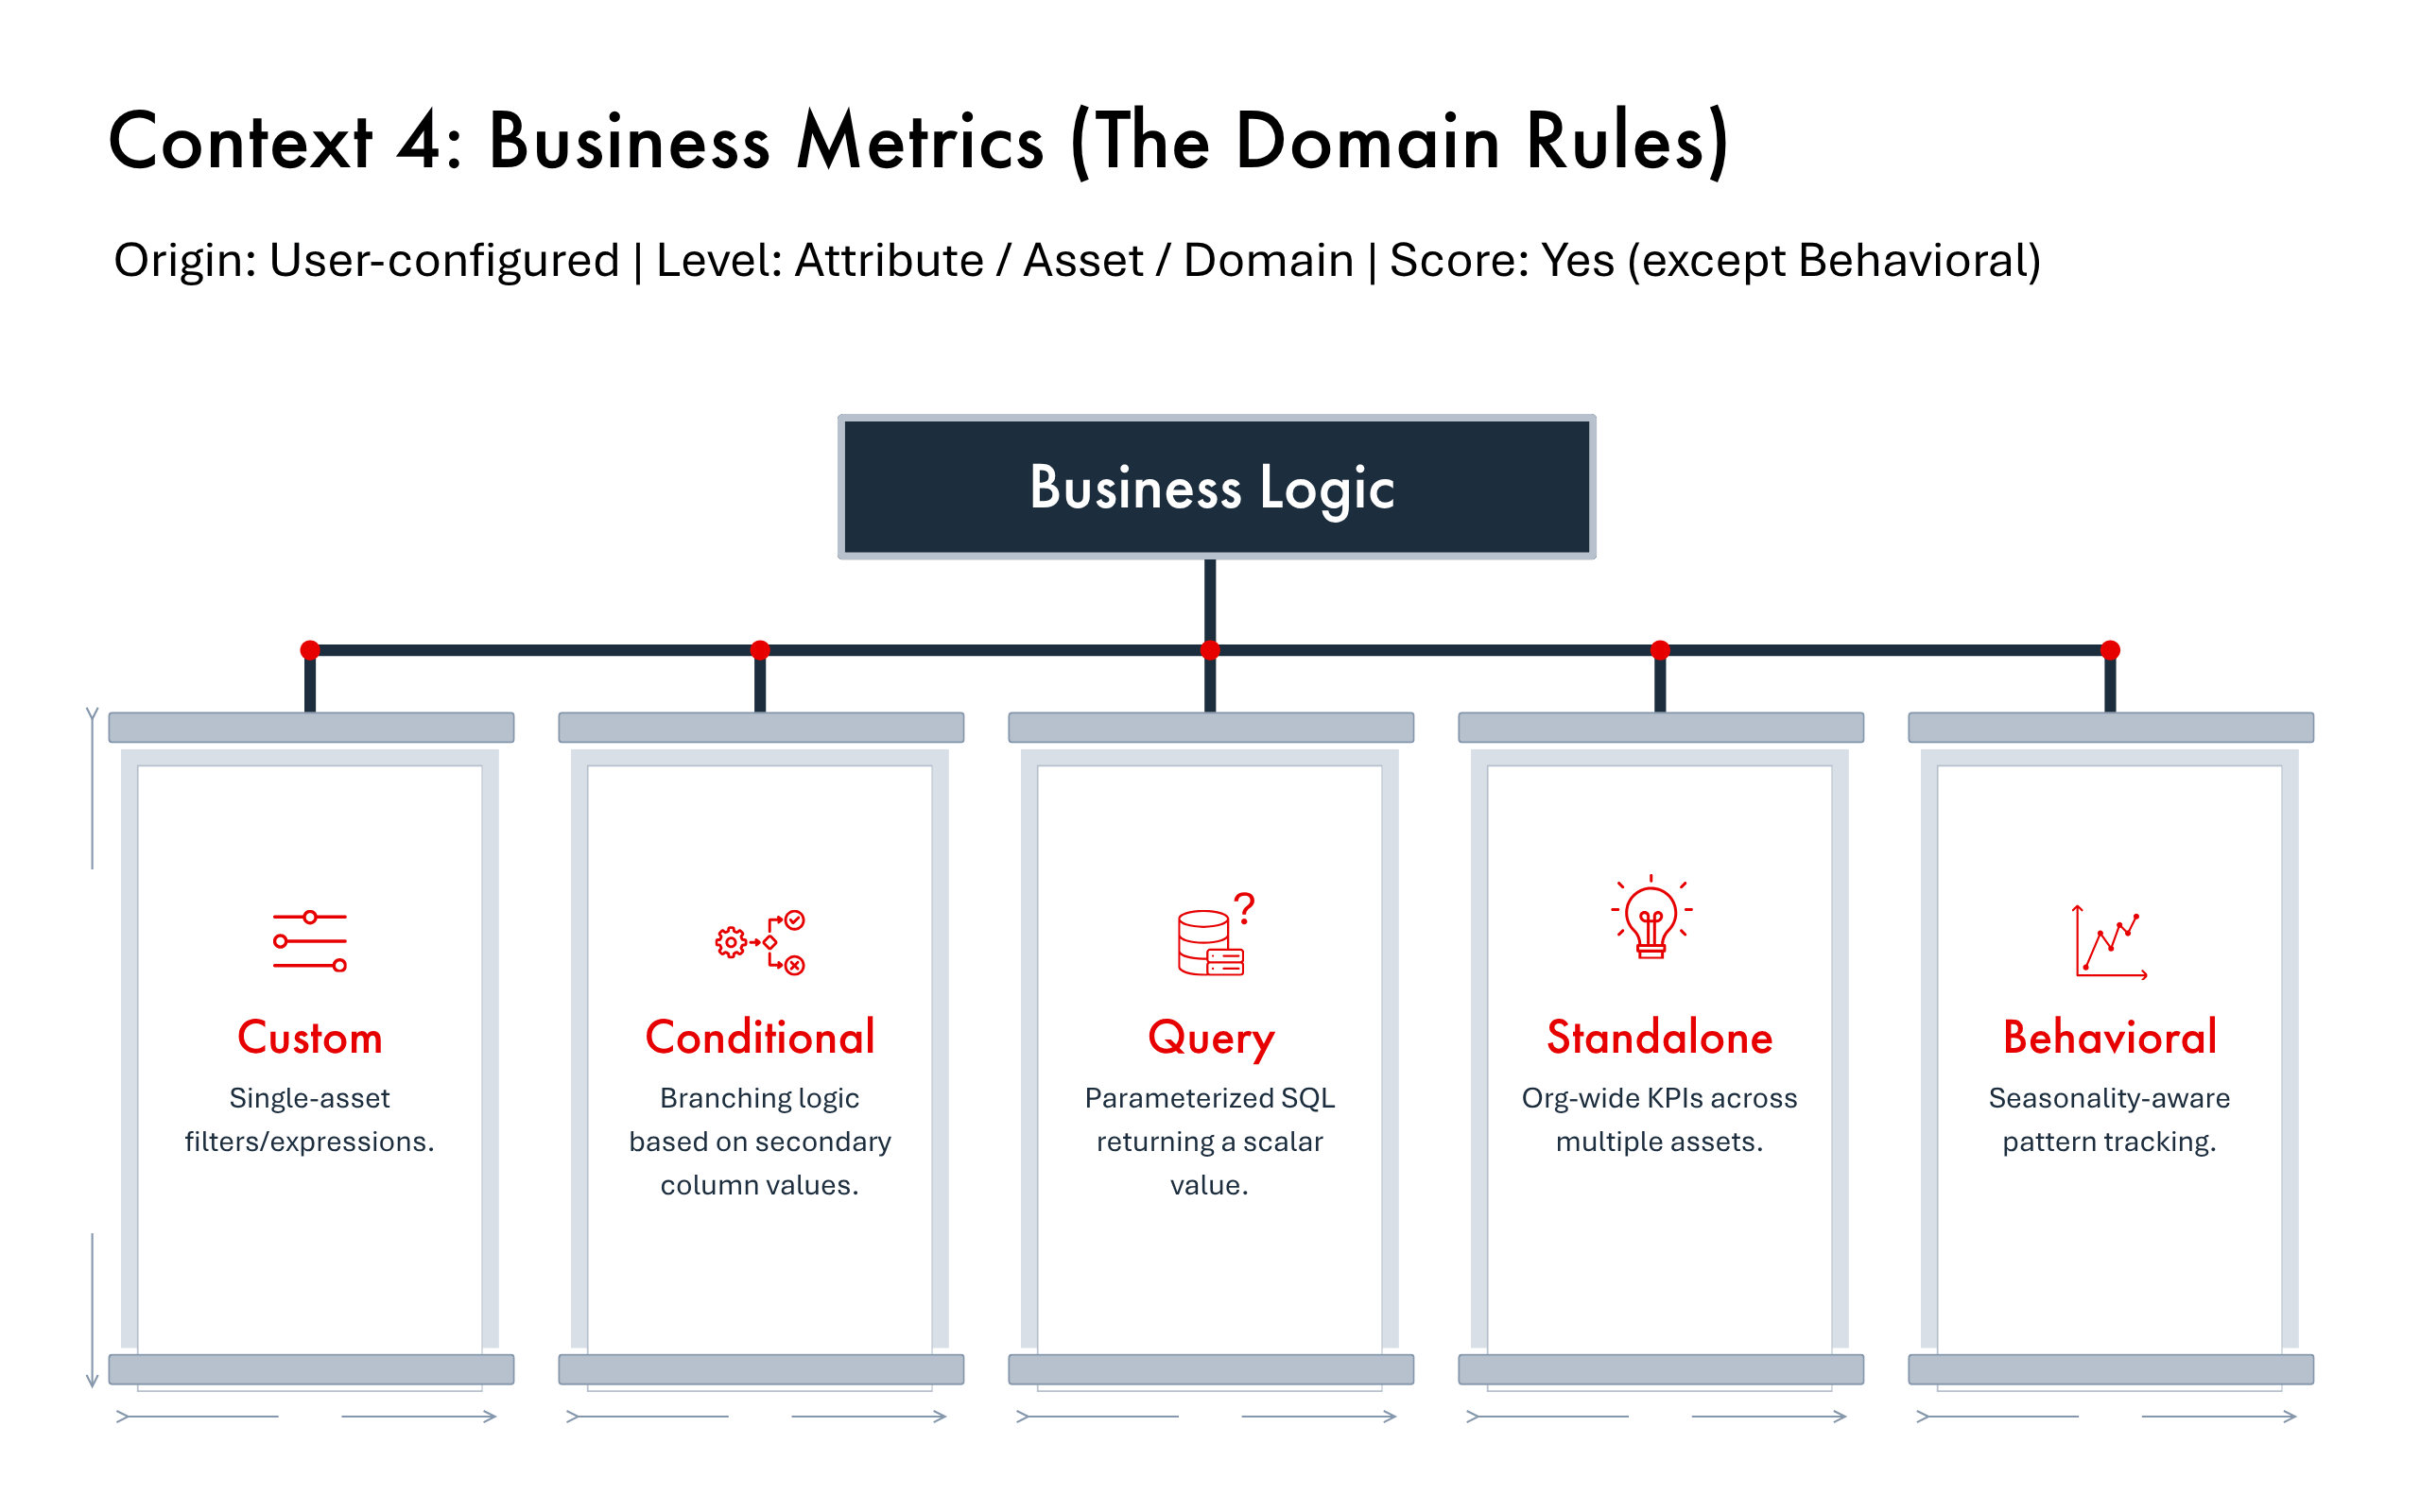
Five types:
| Type | What it does | Example |
|---|---|---|
| Custom | A rule applied to a specific asset using filters, expressions, or threshold rules. The most flexible and most common type. | “The discount_pct column must never exceed 100” |
| Conditional | Applies different logic or thresholds depending on the value of another column or condition. | “If country = 'US', zip_code must be 5 digits; otherwise 6–8 characters” |
| Query | Defined entirely by a SQL query returning a scalar value. Enables joins, aggregations, and CTEs beyond expression-based rules. | “Count of orders with no matching customer record in the CRM table” |
| Standalone | Not bound to a specific asset. For org-wide KPIs and cross-domain aggregations. | “Overall percentage of customer records with a valid email across all regional tables” |
| Behavioral | Evaluates patterns over time rather than at a single point — trend changes, seasonal deviations, gradual drift. | “Alert if daily transaction volume for Product A drops more than 15% below the 30-day rolling average” |
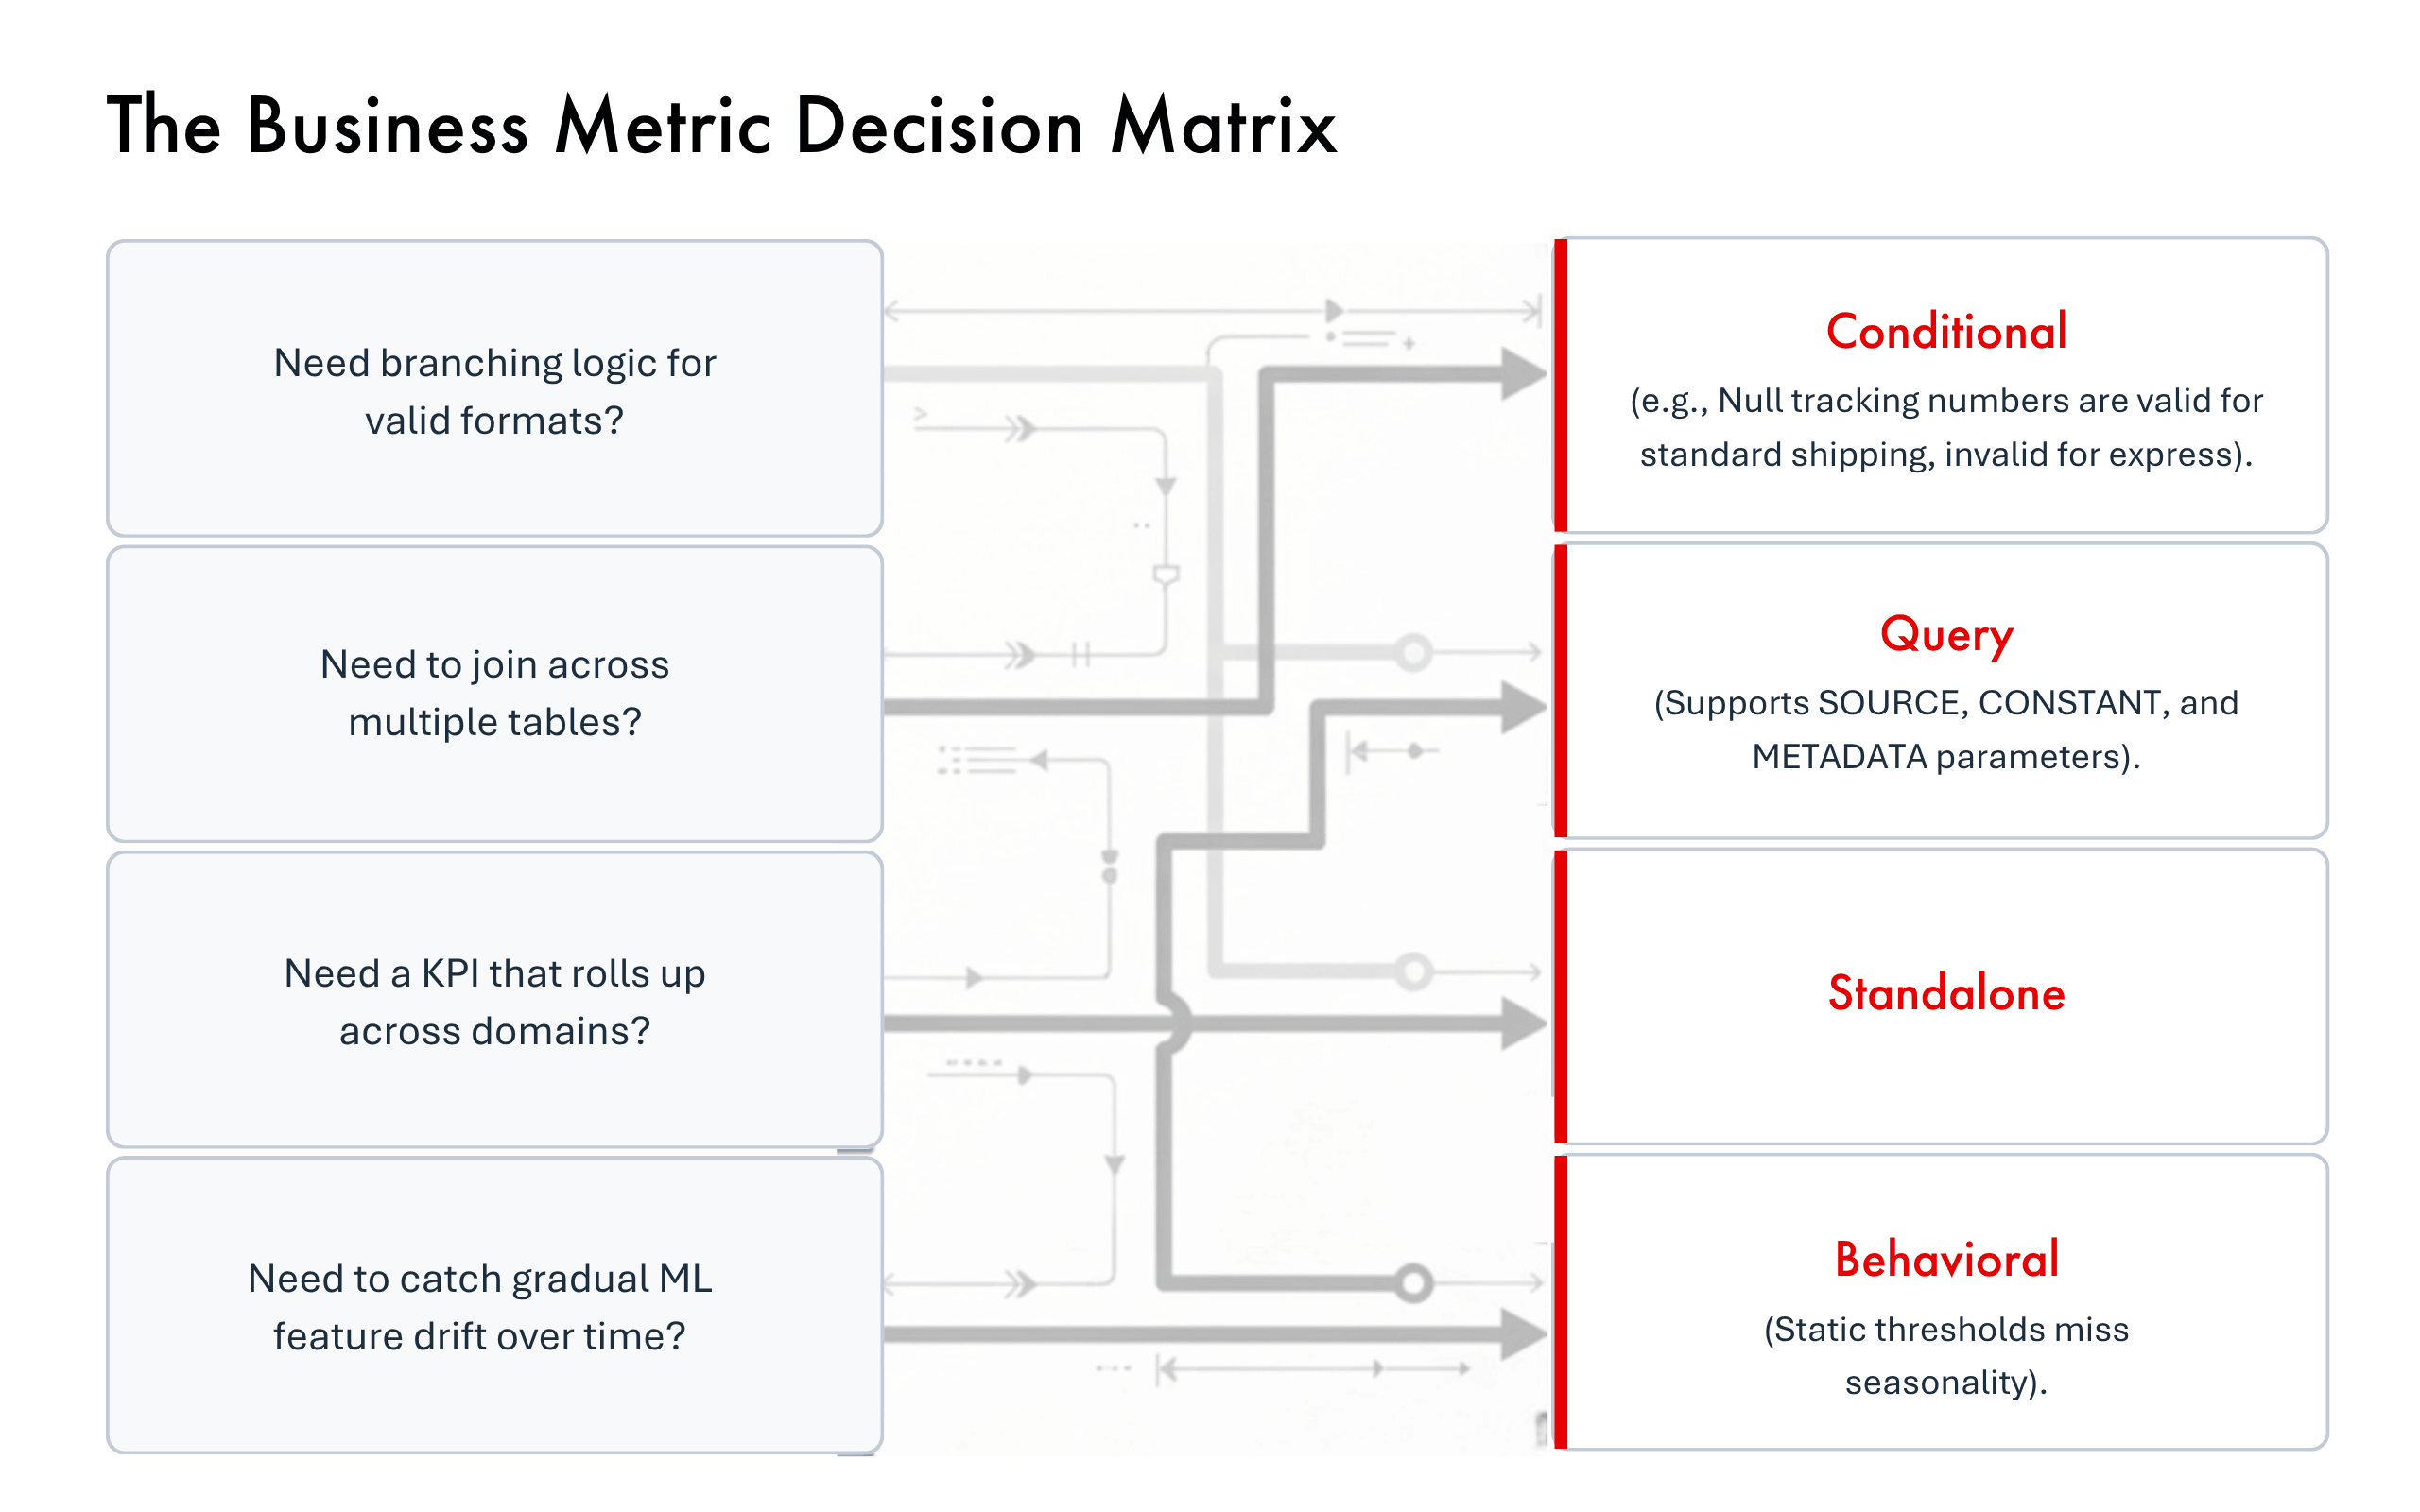
Choosing between them
The decision is usually driven by the shape of the rule, not the severity of the problem:
| If your situation is… | Use | Because |
|---|---|---|
| A domain rule the platform cannot infer | Custom | The logic is a single-asset constraint |
| The same column has different valid formats depending on another column | Conditional | The rule needs branching, not a second metric |
| The rule spans multiple tables or requires a JOIN | Query | Expression-based rules cannot join |
| You need a KPI that rolls up across many assets | Standalone | No single asset is the natural home |
| You need to catch gradual drift by segment rather than a point-in-time violation | Behavioral | A static threshold would miss seasonality |
| You need to enforce a data contract with a downstream consumer | Custom or Query | Contract terms are usually explicit and testable |
Two worked examples make the Conditional and Behavioral cases concrete.
order_type = 'express' rows only, then add a row check requiring carrier_tracking_number is not null. Only express orders are evaluated, so missing tracking numbers on standard orders — where they are legitimately absent — do not affect the score. Without scoping, the same rule generates constant noise and a permanently depressed score that stewards learn to ignore.Behavioral metrics also cover a use case that is becoming standard practice: ML feature drift. A propensity_score feature that historically ranges 0.3–0.7 with a stable mean, then drifts to 0.15 after a scoring-logic change, is caught on the trend break — before the degraded feature reaches production model inference.
Query metrics support runtime parameters. Placing {{param_name}} tokens anywhere in the SQL turns a fixed check into a reusable one:
-- Standard query — fixed logic SELECT COUNT(*) FROM orders WHERE status = 'failed'
-- Parameterized query — values injected at run time SELECT COUNT(*) FROM {{table}} WHERE status = 'failed'
AND business_date >= {{start_date}} AND region = {{region}}
Parameters resolve three ways: SOURCE parameters ({{table}}, {{schema}}, {{attribute}}) auto-resolve from the asset bound to the metric; CONSTANT parameters pull from org-level constants defined in Settings; METADATA parameters resolve from the platform metadata graph using dot notation ({{Asset.Name}}, {{Metric.Tag}}). Every execution stores a full audit record — resolved_sql, effective_params, status, value, triggered_by — which is what makes parameterized SQL auditable.
Where the same parameterized logic should apply across many assets with individual overrides, a Metric Template lets you write the rule once, assign it to many assets, and update every assignment in a single edit.
Type 5
Reconciliation metrics
Reconciliation metrics compare data across sources, snapshots, or reference tables to verify consistency. It is the smallest context by metric count and the most consequential for cross-system data contracts, regulatory reporting, and ETL validation.
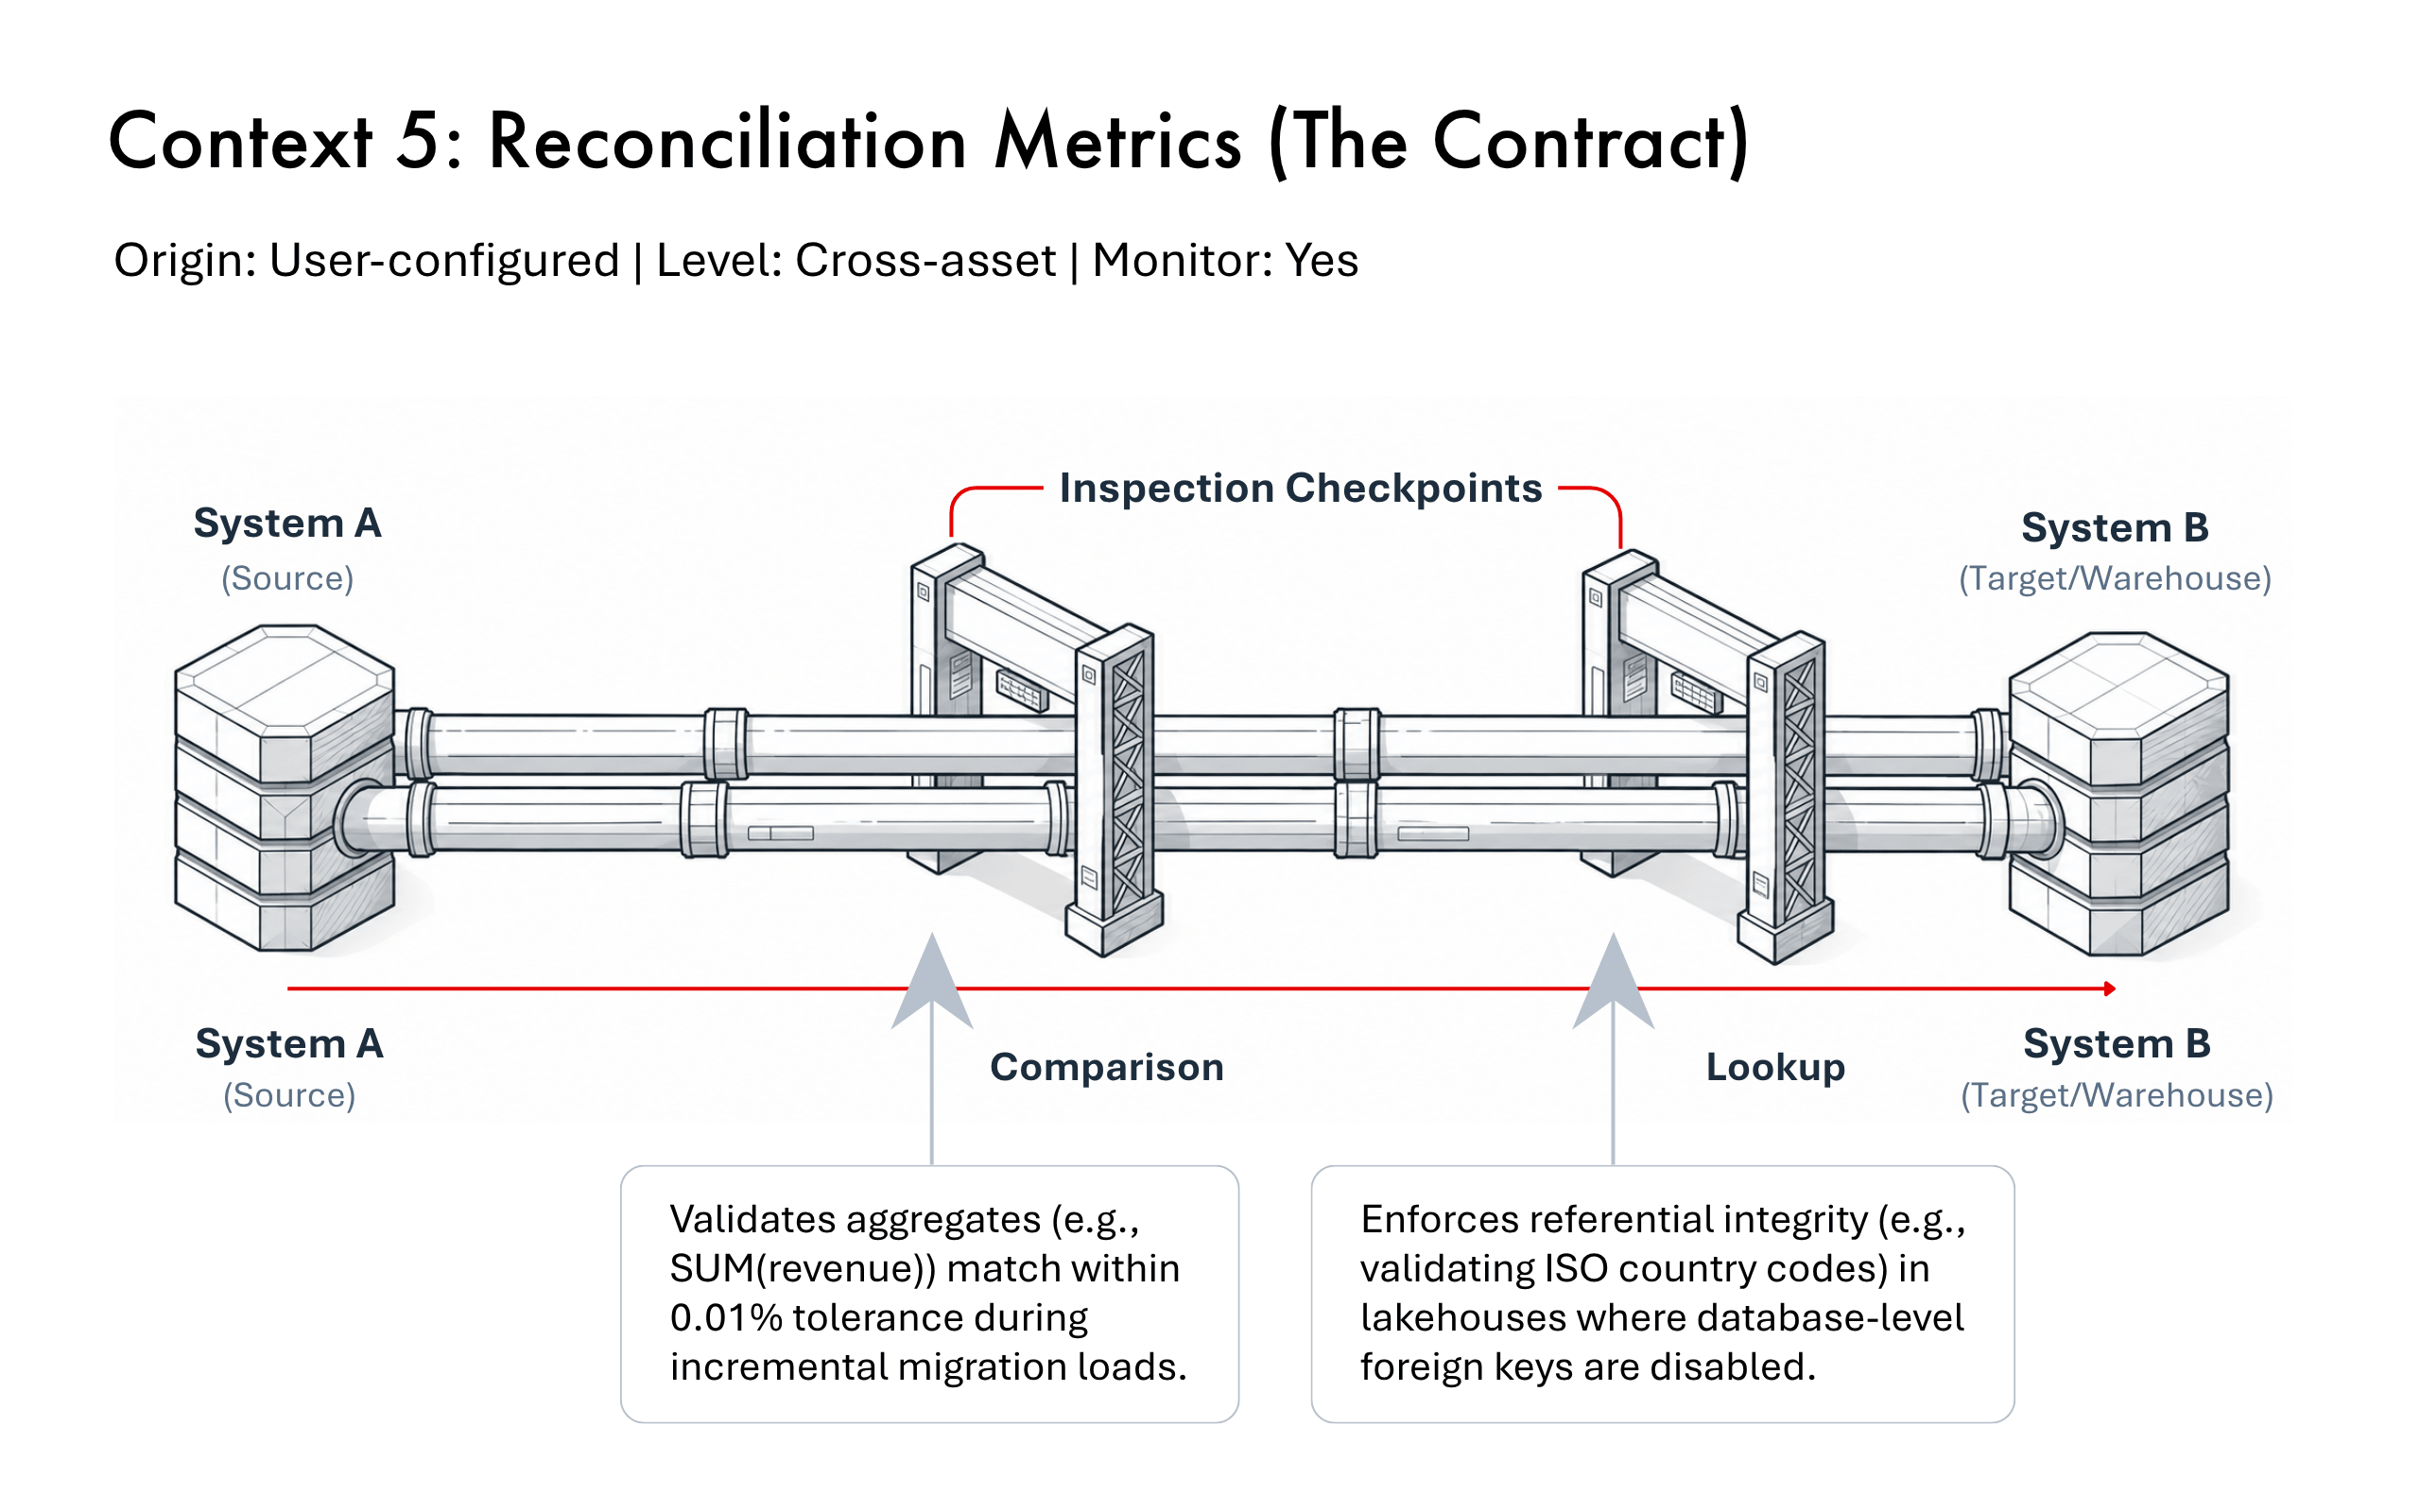
Two types:
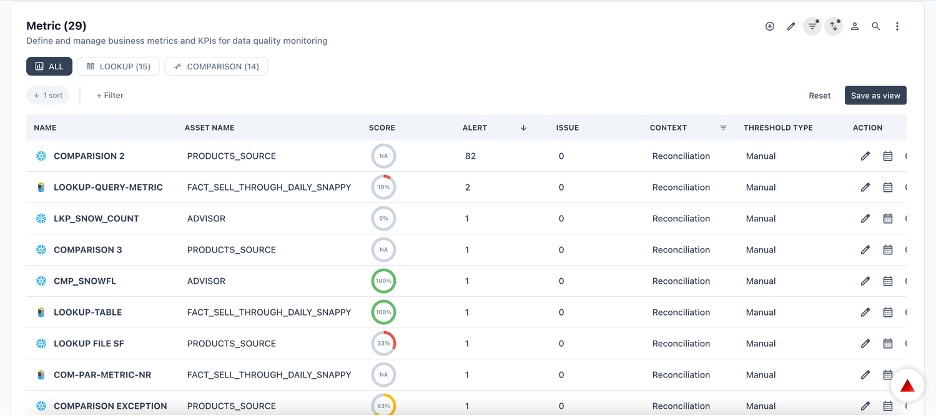
- Comparison — compares a column or aggregate value between two registered assets. Row count in a source table versus the same table after an ETL load; a revenue total in the warehouse versus the source system. Returns a match score and flags discrepancies exceeding a defined tolerance.
- Lookup — validates that every value in a column exists in a reference dataset or allowed set. Referential integrity, without a database-level foreign key.
Where Comparison earns its place
- Data migration validation. Moving from on-premise Oracle to Snowflake, a Comparison metric validates
COUNT(*)andSUM(revenue)match within 0.01% tolerance on every incremental load during the migration window. Drift above tolerance pauses cutover. Critically, this runs continuously through the migration — not only at cutover — so parity breaks surface when they happen rather than at the end. - Staging vs. production parity. Before promoting a dbt model change, verify the staging model’s output matches production on key aggregates, catching unintentional logic changes before they hit live dashboards.
- Pipeline checkpoint reconciliation. Comparing
COUNT(DISTINCT order_id)at every stage (Source → Lake → Warehouse → Mart) identifies precisely which transformation dropped records.
Where Lookup earns its place: any column representing a foreign key relationship not enforced at the database level — product codes, account IDs, country codes, status values drawn from a master data table. These violations are common in warehouses and lakehouses where FK constraints are disabled for performance.
country_code for every customer, validated by a Lookup metric against a static reference file of ISO 3166-1 alpha-2 codes. When a data entry team starts entering “United States” instead of “US,” the match rate drops and PRIZM alerts — surfacing a process breakdown before it corrupts every downstream segmentation report.Monitor vs. Score: the two settings behind every metric
Under the hood, every metric is configured to answer one or both of two questions:
- Monitor — should this raise an alert if something looks wrong?
- Score — should this count toward the asset’s overall trust score?
| Context | Monitor (drives alerts) | Score (drives trust score) |
|---|---|---|
| Operational | Yes | No |
| Performance | Yes | No |
| Structural | — | Yes |
| Business | — | Custom, Conditional, Standalone: Yes. Behavioral: No |
| Reconciliation | Yes | — |
This split is the most important thing to understand about the metric model, because it resolves a conflict most quality platforms leave open. A warehouse running slow should not drag down a table’s quality score — but it absolutely should trigger an alert. A table that stopped refreshing is an incident, not a verdict on the data’s fitness for purpose.
Keeping observability (“is something broken right now?”) separate from scoring (“is this asset trustworthy overall?”) is what keeps both signals meaningful. When they are merged, scores become a lagging proxy for pipeline uptime.
Individual metrics expose directly in their configuration panel, alongside the other options that govern how a metric behaves:
| Option | What it controls |
|---|---|
| Valid | Whether a result within pass criteria counts as a valid run |
| Scoring | Include this metric in the asset’s overall quality score |
| Weightage % | Relative weight of this metric in the overall score (default 100) |
| Pass Criteria | The condition the result must satisfy to pass (default ≥ 100) |
| Export | Include metric results in data exports |
Thresholds: Auto, Limit, and Custom
Metric type determines what is measured. Threshold type determines when that measurement is considered a problem — and it is configured independently, per metric, from the Configuration tab.
| Type | Best for | How it works |
|---|---|---|
| Auto | Metrics with variable historical patterns | ML-based anomaly detection using a statistical baseline learned from run history |
| Limit | Metrics with known, fixed acceptable ranges | A single explicit bound. Fires when the value crosses it |
| Custom | Metrics needing multiple named criteria with different rules, priorities, and actions | One or more named criteria, each evaluated independently per run |
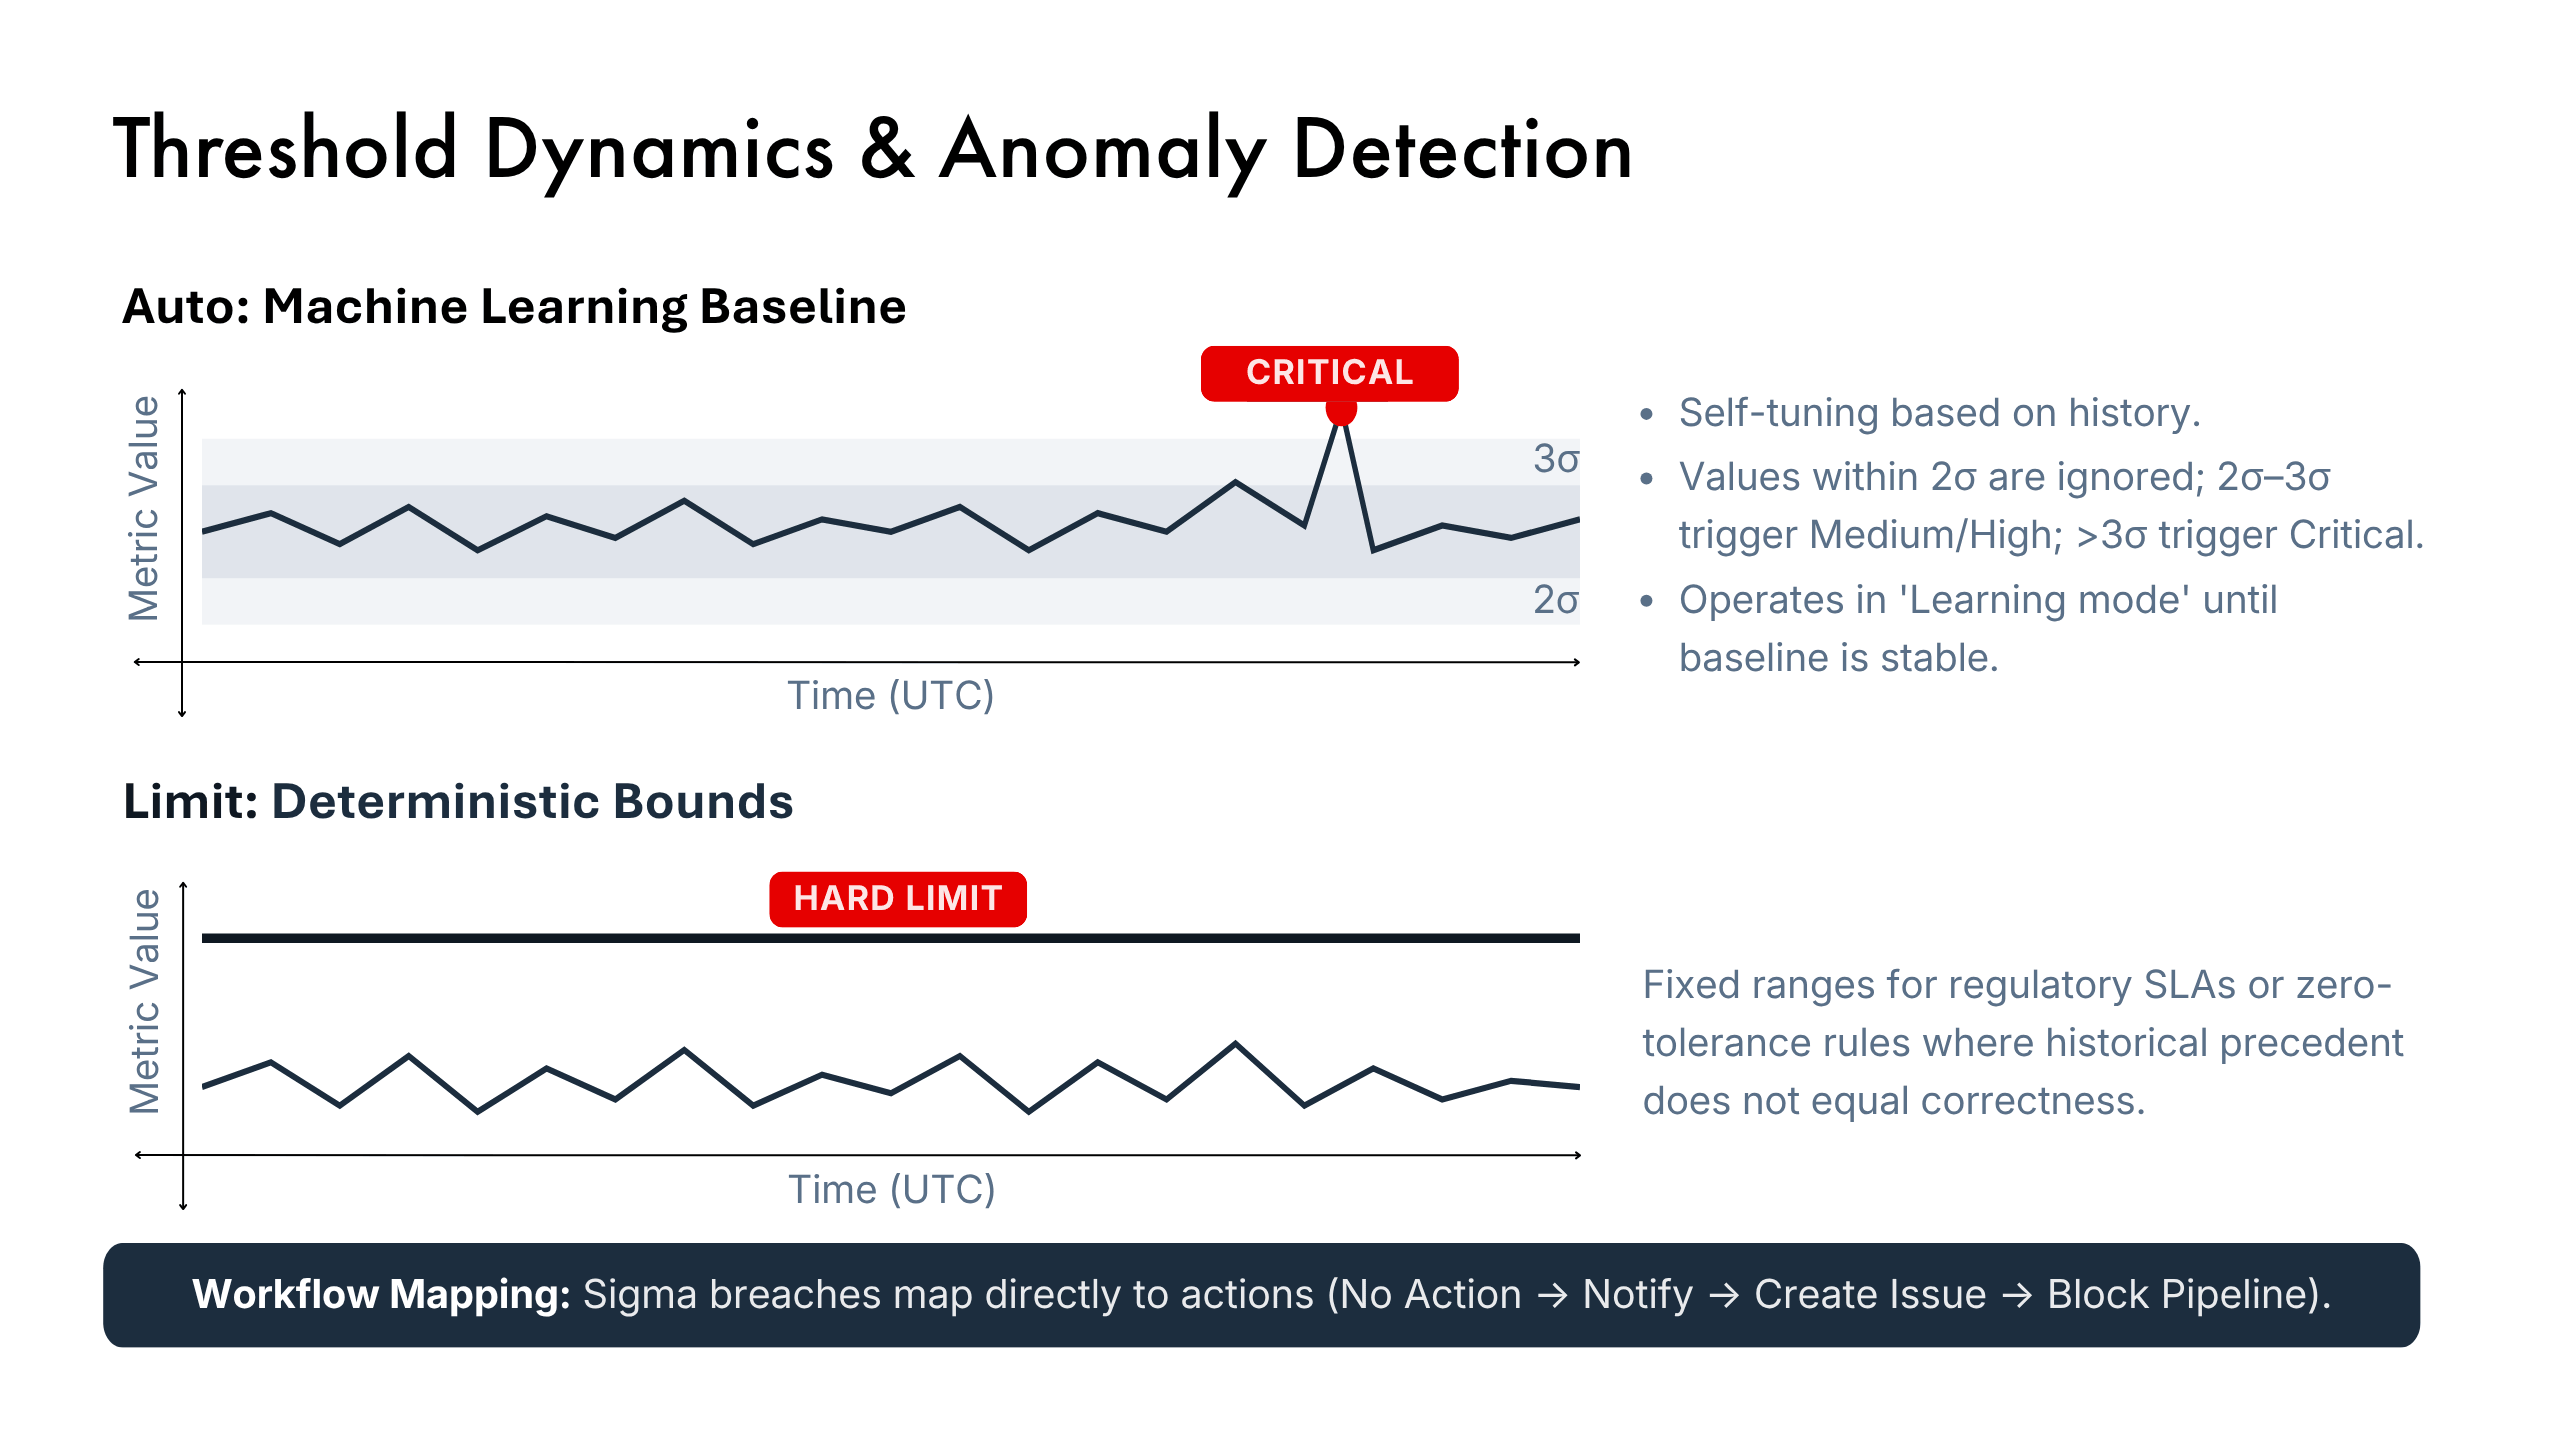
Auto thresholds compute a rolling mean and standard deviation, then flag values deviating beyond configured sigma bands. Defaults: within 2σ, no alert; 2σ–3σ, Medium or High; beyond 3σ, Critical. Two settings tune this:
- Sensitivity — Tight (narrower bands, more alerts), Standard, or Loose (wider bands, fewer alerts).
- Lookback window — 7 days to 1 year. A shorter window makes the baseline more reactive to recent changes; a longer one gives a more stable baseline.
Each sigma band carries its own action, which is where thresholds connect to workflow rather than just notification:
| Action | Effect |
|---|---|
| No action | Alert recorded, no notification |
| Notify owner | Notifies the asset owner and alert audience |
| Create issue | Automatically creates a PRIZM issue linked to this alert |
| Block pipeline | Signals downstream orchestrators to halt execution |
A Medium-band breach can notify the owner while a Critical breach blocks the pipeline — from the same metric, without duplicating it.
Limit thresholds define an explicit bound where historical data is not a reliable guide for what normal looks like. Conditions include Equal to (= 0 for a zero-tolerance null check), Not equal to, Greater than, Less than (< 0.95 for a 95% completeness SLA), and Between (0.98 to 1.02). Severity — Critical, High, Medium, Low — is set explicitly.
Thresholds also adapt to what the metric actually measures. Freshness thresholds are time-based, operating on staleness duration in milliseconds through hours. Schema thresholds evaluate column count as a numeric time series — with an important nuance: structural change alerts (column add, delete, rename, type change) fire on every detected change regardless of threshold configuration. The threshold governs the statistical anomaly layer sitting on top of the deterministic change-detection layer.
Extending metrics to pipelines
A dbt pipeline is not a single asset. It is three connected layers: the models that transform data, the tests that validate it, and the jobs that orchestrate the runs. PRIZM tracks metrics at all three — and each one belongs to the same Operational, Performance, or Business contexts already described. Pipeline health is not a separate system; it is the same model applied one layer earlier in the chain.
| Level | Metric | Context · Category | What it answers |
|---|---|---|---|
| Model | Freshness | Operational · Availability | Has this model run within its expected window? |
| Model | Execution time | Performance · Usage | How long did the model take to run? |
| Model | Rows affected | Operational · Volume | How many rows did the last run touch, and is that normal? |
| Test | Test success rate | Business · Conditional | What share of this model’s dbt tests passed recently? |
| Test | Test execution time | Performance · Usage | Is the test suite taking longer to run? |
| Job | Job duration | Performance · Usage | How long did the job take end to end? |
| Job | Job run frequency | Operational · Freshness | Is this job still running on its expected cadence? |
| Job | Execution status | Operational | Did the last run succeed, fail, get skipped, or get cancelled? (a categorical per-run state, not a rolling average) |
Failure also cascades correctly. When a model’s execution fails, PRIZM checks the freshness of the table it feeds on that table’s own schedule; root cause analysis on the resulting alert surfaces the model that caused it, even if that model had no alerting enabled. Alerts tracing to the same underlying issue cluster together — resolve the root cause and every alert in the cluster resolves with it.
Building data quality coverage that holds up in 2026 and beyond.
Three shifts are changing what “adequate coverage” means, and each maps to a specific metric type.
- Data products carry contracts. A published data product makes explicit promises about freshness, completeness, and consistency. Operational metrics cover the freshness and volume terms automatically. The consistency terms — “revenue in the mart must match revenue in the source system to within 0.1%” — need Comparison or Query metrics. A contract without a Reconciliation metric behind it is a document, not a control.
- AI systems consume tables without human inspection. When a model or agent reads directly from a warehouse, no analyst notices that a categorical column gained an unexpected value or that a numeric feature’s mean shifted. Structural metrics — Enum, Value range, Mean, Standard deviation — catch this; Behavioral metrics catch the gradual version before it reaches inference.
- Governance teams are being asked to certify, not document. Certification requires a defensible score, which requires knowing exactly which measures feed it and at what weight. This is why the Monitor/Score split matters: a trust score built from Distribution and Frequency measures with explicit weightage means something. One that also absorbs freshness incidents and warehouse latency does not.
A practical starting sequence
- Connect sources and let the automatic coverage land. Observe what Operational, Performance, and Structural metrics surface for two to four weeks — long enough for Auto thresholds to exit Learning mode.
- Add Business metrics only where a human must supply judgment. Use the decision table above; resist re-implementing checks structural profiling already covers.
- Add Reconciliation metrics at every system boundary where two copies of the same data should agree — running continuously, not only at cutover.
- Tune thresholds, not metric counts. Most alert fatigue traces to threshold sensitivity and unscoped rules. Use Select criteria to narrow which rows a rule applies to before adjusting sensitivity.
- Set weightage deliberately. Only Distribution and Frequency measures move the Quality Score.
FAQs
-
How many types of data quality metrics are there?
In PRIZM, five: Operational, Performance, Structural, Business, and Reconciliation. Each is a context that defines who the metric serves and what question it answers, rather than simply a category of check.
-
Which data quality metrics are generated automatically?
Operational and Performance metrics are generated the moment an asset or warehouse is connected. Structural metrics are generated automatically when an asset is profiled. Business and Reconciliation metrics are user-configured, because they encode business judgment the platform cannot infer.
-
Why doesn’t a freshness failure lower my data quality score?
By design. Freshness, Last Updated, Row, Volume, Data Size, Duplicates, Column, Schema, and Schema Name are all marked Score: No. They answer “is this asset behaving as expected?” rather than “how good is this data?” — so they surface as alerts and issues rather than moving the Quality Score.
-
What is the difference between a Custom and a Query metric?
Custom metrics apply filters, expressions, or threshold rules to a single asset through configuration. Query metrics are defined by SQL returning a scalar value, which allows joins, aggregations, and CTEs across multiple tables. Use Query when the rule cannot be expressed against one asset.
-
When should I use an Auto threshold instead of a Limit?
Use Auto when the metric has variable historical patterns and “normal” is best learned from the data. Use Limit when you have a known, fixed acceptable range — a regulatory bound, a contractual SLA, or a zero-tolerance rule — where historical behavior is not a reliable guide.
-
What does a “Degrading” metric state actually mean?
It means the priority burden score sits between 5 and 10, or a persistence override fired: alerts in two or more consecutive runs, or repeating High/Critical alerts in consecutive runs. It indicates sustained anomaly activity rather than a single event.

Recent Publications
DQLabs is named in the Gartner® Market Guide for Data Observability Tools
What Is Data Quality? Why Is It Relevant in the Age of AI?
The Cost of Bad Data Quality: Real Numbers from Enterprise AI Projects
How Self-Driving Works? – Prizm by DQLabs
DQLabs Named a Leader in the Spring 2026 Data Quality Grid® Report

