Summarize and analyze this article with
In this blog, we’ll define monitoring and observability, compare them side by side, and explore how observability enables deeper insights (the “unknown unknowns”) across distributed data architectures. We’ll also discuss practical examples (Snowflake, Databricks, Airflow, dbt, ML pipelines), when to use each approach, and how to gradually evolve from monitoring to full data observability.
What Is Monitoring?
Monitoring is the practice of continuously tracking specific, pre-defined metrics or events in your systems and alerting when those metrics indicate a problem. In the context of data systems, data monitoring typically means setting up checks on known indicators of data pipeline health or data quality, then watching those indicators for breaches of expected thresholds.
For example, a data engineering team might monitor an ETL pipeline by measuring daily row counts, pipeline execution time, error logs, or whether a batch job succeeded. If a batch job fails or if the row count drops below a set threshold, the monitoring system triggers an alert so the team can respond. In a data warehouse like Snowflake, monitoring could track resource usage or query performance and send notifications if capacity or latency exceeds defined limits.
Crucially, monitoring focuses on known unknowns – you decide in advance what signals to measure (e.g. “alert if less than 1000 records loaded” or “alert if pipeline runtime >1 hour”). It’s fundamentally a rule-based, surface-level visibility where data is constantly checked for pre-defined data metrics against acceptable thresholds to alert on issues. If those conditions are met, you get an alert; if not, monitoring assumes all is well.
Common facets of data monitoring include:
- Pipeline job monitoring: Ensuring scheduled jobs (e.g. Airflow tasks) run on time and succeed.
- Data freshness and volume checks: Verifying that data is updated (e.g. daily) and that expected volumes are present (no large drops or spikes beyond set bounds).
- Pre-defined data quality rules: Checking known business rules or schema constraints (e.g. no nulls in a primary key column, no negative values in a revenue field).
- System metrics: Tracking database or warehouse metrics like query errors, CPU usage, or memory, often using cloud/platform monitoring tools.
Monitoring is essentially your first line of defense against data issues – it can catch obvious errors or outages quickly. For instance, if last night’s ETL job didn’t run, monitoring will flag the failure so you can fix it. If today’s data load is only 50% of yesterday’s, a volume monitor can alert you to investigate. In short, monitoring answers “Is everything running as expected right now?”.
However, traditional monitoring has limitations. It’s siloed and reactive – it alerts you to symptoms (effects) but often doesn’t explain the cause. You might know a pipeline failed, but not immediately know why. Moreover, monitors only catch what you explicitly tell them to watch. If an issue arises outside those predefined checks, monitoring might miss it entirely. This is where observability comes in.
What Is Observability?
Data observability is a more holistic, intelligent approach that enables you to fully understand the health and state of your data ecosystem, even when issues are novel or unexpected. In essence, observability is about instrumenting your data systems so well that you can infer internal problems from the system’s external outputs (metadata, logs, metrics, etc.). It goes beyond surface metrics to provide deep visibility and context across all parts of your data pipelines.
Formal definitions describe data observability as “the ability to holistically understand the state and health of an organization’s data, data pipelines, data landscapes and data infrastructure” by continuously monitoring and analyzing a broad range of signals. In practice, a data observability platform will ingest not just metrics, but also metadata, logs, lineage information, data quality statistics, and even ML-driven anomaly detection to create a comprehensive picture. The goal is to quickly spot when “something is off” in your data ecosystem – and pinpoint why.
Key characteristics of observability in data systems include:
- Broad telemetry: Observability collects multiple types of signals. Industry frameworks often cite “five pillars” of data observability: freshness (is data up-to-date?), volume (is all data present?), distribution (are values within normal ranges?), schema (did structure change unexpectedly?), and lineage (how data flows between sources). By monitoring these aspects (and more), observability gives a 360° view of data health. For example, an observability tool might detect that a table’s schema changed (schema pillar) or that a dataset’s statistical distribution has drifted from its usual pattern (distribution pillar), which a simple monitor might not catch.
- Dynamic anomaly detection: Unlike static monitors, observability leverages machine learning and advanced rules to identify anomalies without predefined thresholds. It can discover unknown issues by learning baseline behaviors. Data observability can observe data patterns and detect issues without any preconceived rules or policies, meaning it finds anomalies you didn’t explicitly program it to look for. For instance, it might flag a subtle uptick in null values or a change in an ML feature’s distribution that wasn’t on any watchlist.
- Context and root-cause analysis: Observability doesn’t just raise an alarm; it provides context to investigate. Through features like data lineage graphs, dependency mapping, and metadata, a good observability platform will help trace an anomaly to its source. Monitoring tells you that something happened, while observability helps you understand why by leveraging all the available data. For example, if an upstream data source is delayed causing a downstream dashboard to break, an observability tool might automatically highlight that upstream dependency as the likely root cause via lineage.
- Proactive insights: Ultimately, observability aims to detect and address issues before they turn into major incidents. It’s inherently more proactive. By continuously analyzing trends, an observability solution might predict a data pipeline is at risk of missing an SLA and alert you ahead of failure. It focuses on reducing mean-time-to-detect (MTTD) and mean-time-to-resolve (MTTR) for data incidents. In other words, observability is an early warning system for data reliability. As Gartner explains, these tools “go beyond traditional monitoring by enabling users to observe changes, discover unknowns, and take appropriate actions to prevent firefighting and business interruption.”.
To illustrate, imagine a data observability platform monitoring a complex data pipeline: it tracks the pipeline’s operational metrics (like a monitor would) and the quality of the data flowing through it. It might notice that a particular upstream feed has an unusual spike in duplicates and automatically flag this anomaly, correlate it with a recent deployment (via logs/metadata), and notify the team with a root cause hypothesis. All this happens before end-users complain about wrong data in a report. This depth of insight is the power of observability.
In summary, data observability = monitoring + much more. It encompasses monitoring of known metrics plus intelligent observation of patterns to catch the unknown unknowns. Monitoring is best suited for known failure modes, while observability is for debugging using the insights inferred.
Monitoring vs. Observability: Key Differences
Both monitoring and observability aim to improve reliability, but they differ fundamentally in scope and approach. The table below highlights the key differences between data monitoring and data observability:
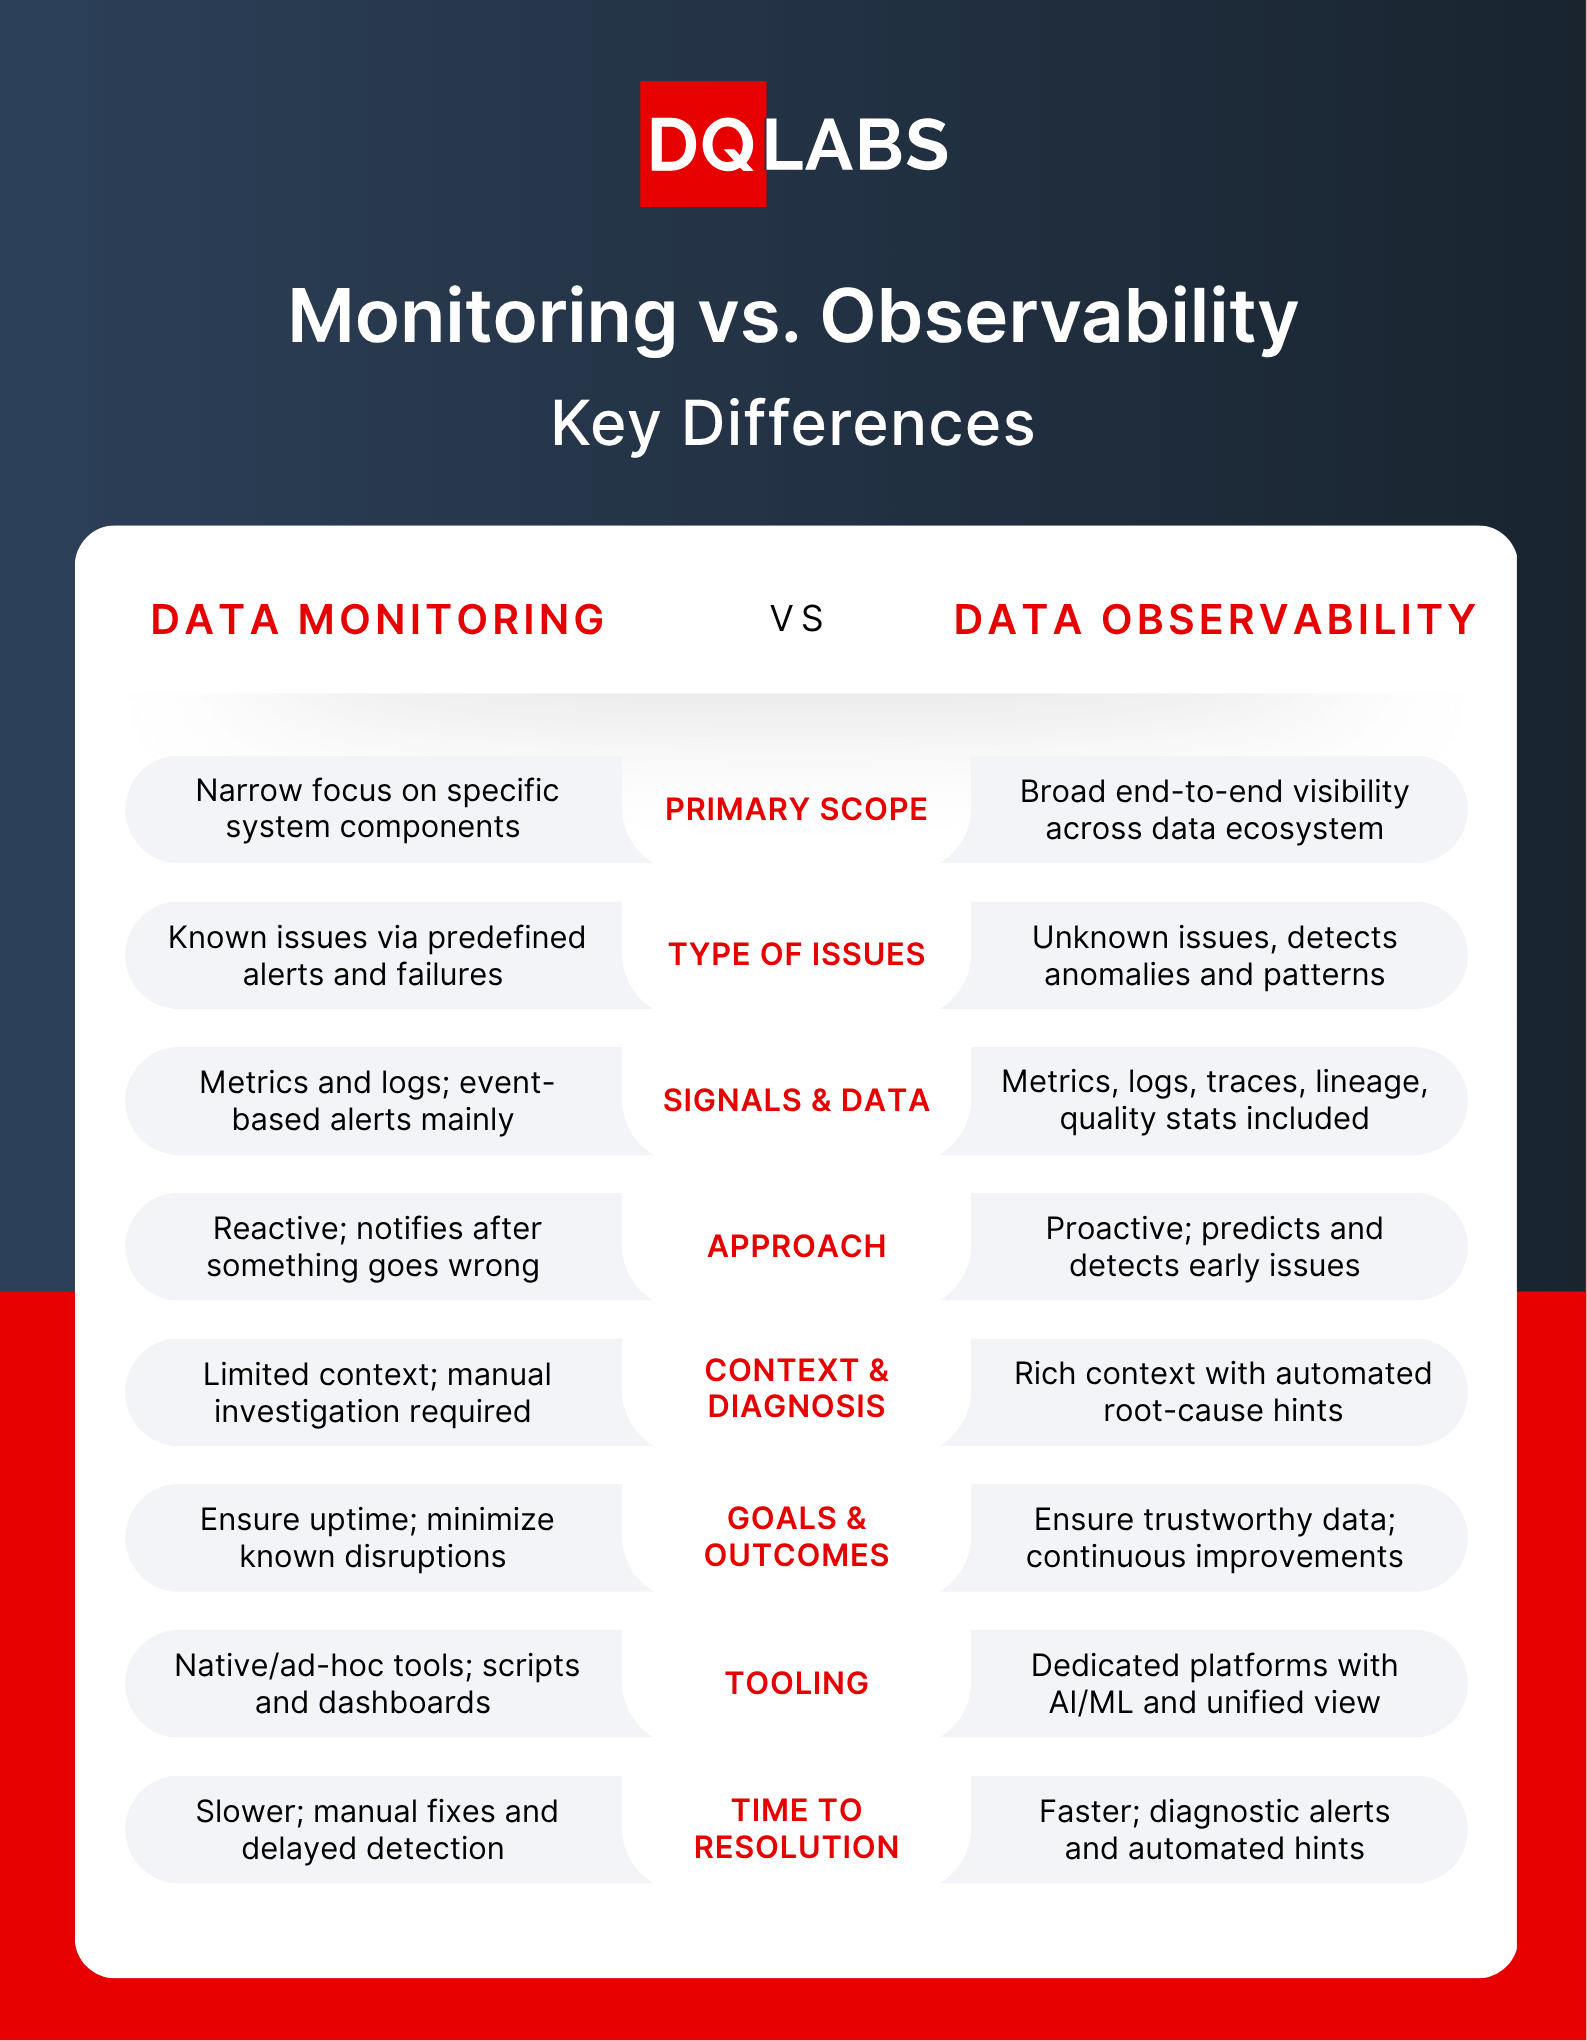
In short, monitoring tells you that something’s wrong; observability helps you understand what and why it’s wrong, across complex data architectures. Monitoring uses metrics to flag issues (effects), whereas observability provides context to uncover root causes. Monitoring alone might say “dataset X is stale” – observability would reveal which upstream source caused it and whether other datasets are impacted.
Another way to frame the difference: traditional monitoring assumes you know what to watch (you have to anticipate failure modes), so it’s not well-suited for surprises. Observability, however, is designed to handle surprises. As Gartner notes, “traditional monitoring tools are insufficient to address unknown issues. Data observability tools learn what to monitor and provide insights into unforeseen exceptions.” In essence, observability extends monitoring from a set of static gauges to an adaptive, intelligent nervous system for your data environment.
When to Use Monitoring vs. When Observability Is Essential
Monitoring and observability aren’t mutually exclusive – in fact, observability encompasses monitoring. The question for data teams is really when is basic monitoring enough, and when do you need full observability?
Use monitoring (alone) for:
- Basic, stable pipelines or small-scale systems – If you have a simple data pipeline with predictable data and few dependencies, setting up basic monitors (e.g. check that the pipeline ran and data landed) may be sufficient. For example, a daily CSV import into a single database might only need monitoring of file arrival and row counts.
- Known metrics with clear thresholds – When you are confident about what “normal” looks like and can define static thresholds (and the cost of missing an anomaly is low), monitoring can cover those needs. E.g., monitoring that a report refresh completes by 8am daily, or that a table’s row count doesn’t drop to zero.
- Initial stages or budget constraints – Monitoring is a good starting point if your team is just beginning to improve data reliability. It’s simpler and often cheaper (many monitoring features are built into existing tools). If you’re at an early maturity stage, you might implement basic data quality checks and monitors first.
However, relying on monitoring alone starts to break down as data systems grow more complex and the stakes get higher. You’ll know you need to advance to observability when:
- Issues are slipping through undetected. If you’ve experienced incidents where “we didn’t know there was a problem until a user complained” or you find data errors that none of your monitors caught, that’s a red flag. It means there are unknown unknowns in your environment that require observability. As Gartner suggests, identify gaps where current monitoring can’t flag critical issues or SLAs are still being missed – those are ideal areas to pilot observability.
- You manage distributed or modern data architecture. The more pipelines, tools, and data products in your stack, the harder it is to monitor each in isolation. Observability shines in distributed data architectures (multi-step pipelines, microservices, multi-cloud data sources, etc.) by giving end-to-end oversight. If your data flows span many systems (e.g. ingest in Kafka, ETL in Spark, load to Snowflake, then transform with dbt), simple monitors in each tool won’t catch everything. Observability is essential to see the big picture and interconnections.
- Root-cause analysis is slow or painful. Do your engineers spend hours combing through logs and SQL queries to figure out why a data job failed or why numbers are off? Observability can drastically shorten this by providing lineage and centralized anomaly tracking. When time-to-resolution for data incidents is too high, observability provides the needed context to speed it up.
- Data is mission-critical (especially for AI/ML). If downstream decisions, analytics, or ML models rely on the data, proactive reliability becomes paramount. In scenarios like real-time analytics or ML model pipelines, you can’t afford undetected data quality issues. Observability becomes essential to ensure trust in data for these high-impact use cases (more on this in the next section).
In summary, monitoring is sufficient for known, straightforward scenarios or as an entry-point to data reliability. Observability is essential for complex, dynamic, or high-stakes data ecosystems where unknown issues can lurk. Many organizations evolve from monitoring to observability as they scale. In fact, it’s increasingly seen as a data ops best practice – by adopting observability, enterprises move from reactive data operations to a proactive, resilient posture.
Tip: It’s not “observability or monitoring” – consider it “monitoring and then observability.” Monitoring builds the foundation (you still need those basic metrics!), and observability builds on top to provide complete visibility and fast troubleshooting. Next, let’s look at some concrete examples to ground these concepts.
Real-World Examples in Data Pipelines and Workflows
To make the distinctions more concrete, let’s walk through a few scenarios in the data world and see how monitoring vs. observability would play out:
- Data Pipeline (ETL/ELT): Imagine a pipeline that extracts data from an API, loads it into a staging database, then transforms it into a warehouse. Monitoring for this pipeline might include checks like: did each task succeed or not? did the pipeline finish on time? If the API extraction task fails, a monitor sends an alert email. This is useful, but consider a subtler issue: the pipeline succeeded but the data it loaded is incomplete because the API returned empty results for one category. Basic monitors (task success/failure) wouldn’t catch that – the pipeline didn’t technically fail. An observability approach would track data metrics within the pipeline: e.g., the number of records extracted from the API or the distribution of values. It could detect that today one category’s data is 90% lower than usual (an anomaly in volume/distribution) and alert the team. Moreover, by integrating with lineage, the observability tool might show that this missing data will affect two downstream tables and dashboards, giving engineers a heads-up to mitigate impact. In short, monitoring would say “pipeline succeeded” (all good) whereas observability would surface “pipeline output is abnormal” (potential problem) with context on where and why.
- Data Warehouse / Lake (Snowflake, Databricks): In a cloud data warehouse, monitoring often covers resource and performance metrics – e.g., Snowflake’s built-in monitoring can track credit usage, query runtime, or failed queries. If a load process doesn’t run, a monitor triggers. Observability in this environment adds a layer of data-centric insight: for instance, it watches schema changes on critical tables, data freshness of each table, and quality metrics. A practical example: A new deployment accidentally changes a table’s schema or drops a column. Monitoring might not catch this if queries still run. But an observability tool could automatically detect the schema drift (unexpected change in structure) and flag it. Likewise, observability could notice if a table that’s usually updated hourly hasn’t been updated in 3 hours (freshness lag) and raise an alert before users notice stale data. The observability platform like DQLabs may also tie into the data catalog (e.g., Atlan or Collibra) to enrich alerts with business context like the data owner or downstream dependencies.
- Analytics & BI Dashboards: Consider a business intelligence team using Tableau or Power BI on top of a data warehouse. A monitoring mindset might involve setting alerts on the dashboard load times or whether the BI server is up – important, but more about system uptime. With data observability, you’d monitor the data feeding the dashboards. For example, observability would catch if a key metric in the dashboard suddenly dropped to zero due to a data issue upstream. If a data source didn’t update, observability would alert that the dashboard is now showing day-old data. Essentially, observability ensures the content of dashboards remains trustworthy, not just that the dashboard is online. This reduces those frantic moments when an executive finds a report number that looks wrong – observability helps you catch and fix it beforehand.
- Data Catalogs & Governance (Atlan, Collibra integration): Data catalogs manage metadata and governance policies. By themselves, catalogs might not actively monitor data health; they rely on information entered or scanned. If we integrate observability, the catalog can become aware of data quality incidents. For instance, if an observability tool detects a data quality rule breach (like privacy policy violation or a unique key issue), it can log that incident and even push notifications to the catalog. Monitoring alone typically wouldn’t connect to governance – it might send a generic alert. Observability can enrich governance by providing a lineage view of an incident (what sources, what downstream impacts) and ensuring compliance issues are caught. At high maturity, data observability and governance work hand-in-hand: observability provides the real-time insight and traceability (like cross-silo lineage), while governance provides the rules and context. In fact, the most advanced observability solutions include policy-driven controls and end-to-end traceability to align with data governance needs.
- ML and AI Data Workflows: In machine learning pipelines, data issues can silently degrade model performance. Basic monitoring might check if the ML pipeline executed, and perhaps track simple metrics like “did the model output within expected range.” But observability for ML goes deeper: it monitors data drift, feature statistics, and model inputs/outputs over time. For example, say an online retail model’s input data (user behavior metrics) starts shifting due to a new website feature. Monitoring likely wouldn’t notice until the model’s accuracy drops. Observability, however, could detect that data drift in real-time – e.g., average session time feature has a value distribution completely outside historical norms – and alert data scientists before the model output turns bad. Observability can also track ML-specific signals like data consistency between training and inference, anomalies in model predictions, and more. When models do underperform, having observability means you can quickly check if the data pipeline was the culprit (bad or delayed data) as opposed to the model code. This accelerates debugging of ML issues. In essence, observability supports AI/ML reliability by treating data as a first-class citizen in monitoring. It ensures the data quality, freshness, and completeness feeding models, which in turn preserves model accuracy and trust.
These examples highlight a pattern: monitoring addresses immediate, known operational concerns (pipeline ran or not, system up or not), whereas observability addresses data correctness and unexpected behaviors across the whole lifecycle.
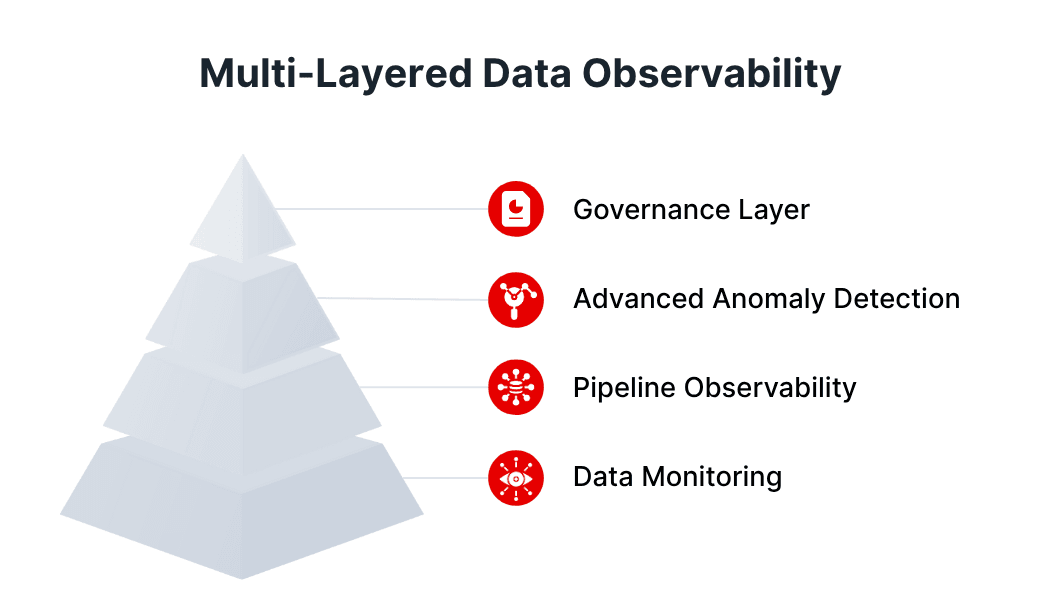
If you’re starting on this journey, follow a phased roadmap: get your basic monitors in place, then gradually layer in broader visibility, anomaly detection, and integration with your data operations. Many teams find that adopting a dedicated data observability platform (such as DQLabs or similar) greatly accelerates this maturation, because it provides out-of-the-box intelligence and coverage. The result of strong observability practices is fewer drills, faster incident resolution, and ultimately more trust in data for decision-making.
Ready to transform your data reliability journey?
Experience how DQlabs’ powerful data observability platform can help you detect anomalies early, gain rich context for faster root-cause analysis, and build unwavering trust in your data.
Book a personalized demo today and see observability in action!