Summarize and analyze this article with
Introduction
Data observability has moved past its original identity as a monitoring practice to now operating at the centre of how data systems are designed, trusted, and corrected. Its evolution has been driven by continuous AI consumption, expanding pipeline complexity, and the operational reality that most failures are discovered too late to prevent downstream damage.
The conventional model works like this: a tool detects an anomaly, fires an alert, and leaves the interpretation to a human. The human actor traces the lineage, evaluates the impact, and decides what to fix. When a data environment has fifty pipelines and a small team, this works. When it has thousands of assets across multiple sources, it does not. The interpretation step becomes the bottleneck, and the time between detection and resolution expands with every new dependency.
What is changing in 2026 is not the number of signals a system can detect. It is the system’s ability to determine which signals matter, connect them to a causal chain, and complete the resolution loop without waiting for a human to reconstruct the incident from scratch. This is the difference between an observability tool and an observability system.
This article outlines how that shift is occurring. It examines why alert fatigue is a structural design failure rather than a volume problem, how context transforms isolated signals into system-level understanding, why criticality scoring is becoming the decision framework that every downstream action depends on, and how autonomous systems are closing the gap between detection and execution.
Key Takeaways
- Detection without interpretation produces noise, not insight. Systems that fire alerts without relating them to lineage, usage, or business function transfer the cost of understanding to the engineer.
- Alert fatigue originates from fragmented signal evaluation across disconnected layers—pipeline, schema, distribution, freshness—each generating alerts independently for the same underlying event.
- Context connects those signals by mapping assets through their lineage, consumption patterns, and governance metadata, turning isolated anomalies into traceable incidents.
- Criticality assigns a weighted importance score to each asset based on usage frequency, consumer count, lineage depth, freshness sensitivity, and downstream reach. This score governs profiling depth, alert priority, and response urgency across the system.
- Autonomous operation means the platform detects, interprets, prioritizes, and acts within a single loop. The engineer’s role shifts from reconstruction to oversight.
- Observability, data quality, and governance are collapsing into one control plane because they depend on the same underlying structures—lineage, usage, and metadata.
- The transition is driven by AI consumption patterns, system scale, and the hard limit of what manual curation can sustain.
The Current Operating Model of Data Observability
Alert Fatigue Is Not a Scaling Issue—It Is a Design Failure
Alert fatigue is the condition where a system generates more signals than any team can interpret or act on within operational timelines. The common explanation is volume: too many alerts, not enough people. The actual cause is structural.
Pipeline execution, schema validation, distribution checks, and downstream consumption layers each generate alerts using their own thresholds and logic. These layers share no state. They do not know whether the freshness delay they detected and the volume anomaly detected by another check are symptoms of the same upstream failure. When a single pipeline disruption propagates downstream, it registers as separate alerts across every layer it touches—freshness delays here, null spikes there, row count drops somewhere else. Each alert is valid within its own scope. None of them know about the others.
The reconstruction burden falls to the engineer. They correlate timestamps, trace lineage manually, separate root causes from downstream symptoms, and determine which of the forty alerts actually require a distinct fix. This is not engineering work. It is incident archaeology, performed under time pressure, using information that the system already possesses but cannot synthesize.
Alert clustering changes this by analysing all incoming alerts against the lineage graph and temporal proximity, grouping related signals into a single incident with a root cause indicator and a propagation timeline. What arrived as dozens of independent notifications resolves into one actionable cluster. The system identifies which upstream event triggered the cascade and which downstream assets are affected. The engineer receives an incident, not a pile of fragments.
This is not an incremental improvement on alerting. It is a different architecture for how failure is represented.
The Missing Layer: Context as a Computational System
Signals that cannot be related to each other cannot be interpreted at scale. Two alerts firing within the same minute on two different tables mean nothing until the system knows that one table feeds the other through a transformation that ran fifteen minutes ago. Context provides the connective tissue.
In practice, context is assembled from three categories of metadata—operational, usage, and governance. Each captures a different dimension of how data behaves, how it is consumed, and how it is classified.
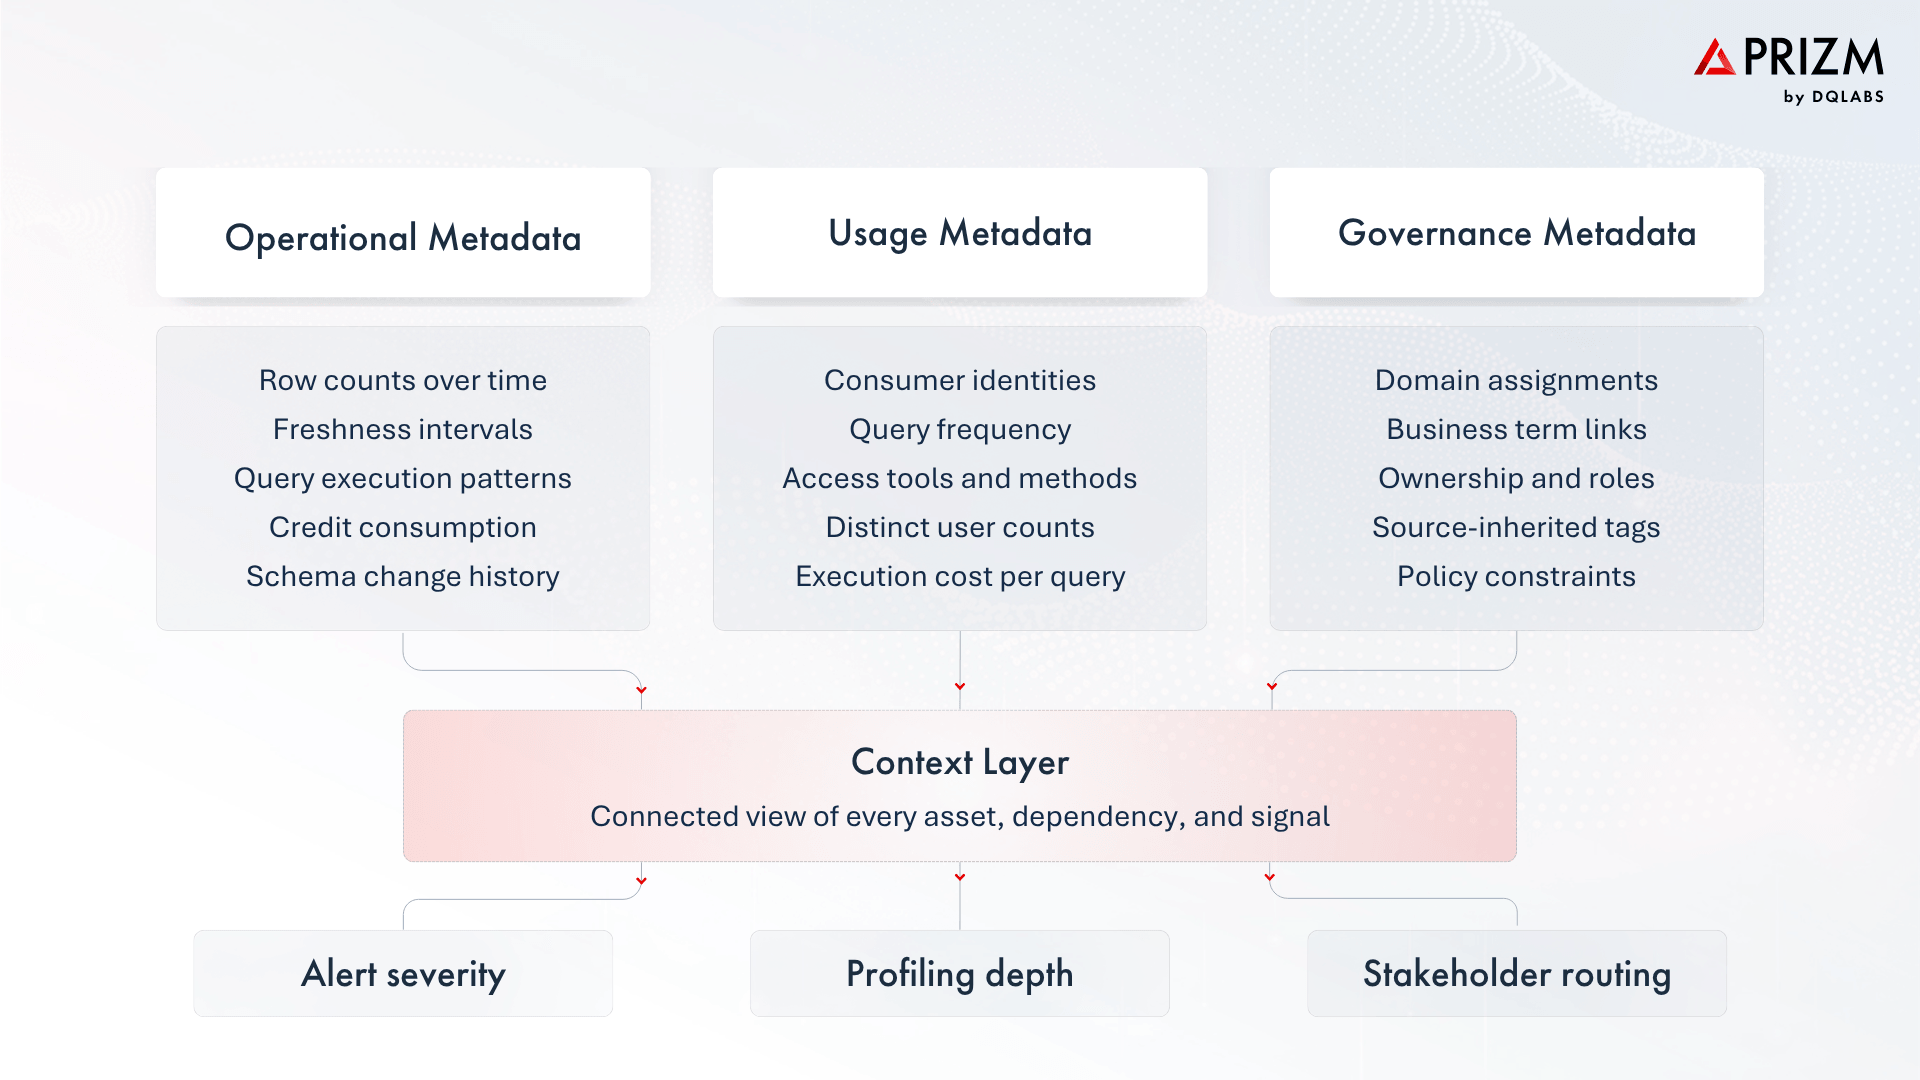
When a system has all three, it stops treating each anomaly as a standalone event. A freshness delay on a table is no longer just a freshness delay. It is a freshness delay on a table that feeds twelve downstream reports, is queried by three hundred users daily, belongs to the finance domain, and has a criticality score that places it in the top tier of monitored assets. The response the system takes, the profiling depth it applies, the alert severity it assigns, the stakeholders it notifies, all follow from that context.
This creates a new problem: once signals are connected and understood in relation to each other, the system needs a mechanism to decide which of them require immediate attention and which do not.
Criticality: The Decision Framework for System Behaviour
Criticality is a composite score that assigns dynamic importance to every data asset in the landscape. It is calculated from several system-level inputs like how frequently the asset is queried, how many distinct users consume it, what its execution cost is, where it sits in the lineage chain, how deep its downstream dependencies go, what governance tags have been applied to it, and how tolerant its downstream consumers are of delay.
These inputs span four broad categories—operational behaviour, consumption patterns, lineage position, and governance state—and are weighted against each other using a dozen factors. The resulting score is not a static label. It recalculates as dependencies shift, as new consumers begin querying an asset, or as governance classifications change. An asset that was low-criticality last quarter can become high-criticality this quarter because a new executive dashboard started consuming it.
The practical consequence is that every downstream system behaviour keys off this score. Profiling depth increases for high-criticality attributes—statistical analysis, pattern distribution, frequency modelling, while low-criticality attributes receive lightweight checks. Metric deployment follows the same gradient: the platform generates operational, performance, and quality distribution metrics automatically, but the breadth and sensitivity of those metrics is proportional to the asset’s criticality. Alert priority is governed by it. Documentation generation, stewardship workflows, and notification routing all reference it.
Criticality does not generate signals or define relationships between assets. It determines how the system responds once those relationships are understood. When paired with context and alert clustering, it forms the decision layer that sits between detection and execution.
At this point, the system can detect conditions, relate them, assign priority, and determine the appropriate response. But in most organizations, it still hands that response to a human for execution. This is where the operating model reaches its structural limit.
The Collapse of Human Middleware
In most data operations today, the execution layer is human-driven. Engineers and data stewards perform three continuous functions: correlating signals into a single incident view, assigning priority based on business impact, and tracing root cause across lineage and transformations. They are the load-bearing structure of how the system operates. But this was never a scalable model. Data ecosystems now support expanding pipeline networks, real-time processing, and AI-driven consumption patterns where models and agents act on data without human review.
The scale math is simple. Most enterprises have curated roughly 10–20% of their data for reliable use through manual effort—writing SQL scripts, triaging alerts, spot-checking outputs. AI readiness demands that 60–70% of enterprise data meet a trust threshold. The gap between what must be trusted and what can be manually validated is widening at a rate that no hiring plan can close.
The structural response is to absorb the functions that humans currently perform into the system itself. Not as workflow automation layered on top, but as embedded capability—where the platform that detects the issue is the same platform that interprets it, prioritizes it, and acts on it.
Autonomous Data Systems
An autonomous observability system operates as a closed loop across four tightly coupled functions: detection, interpretation, prioritization, and execution.
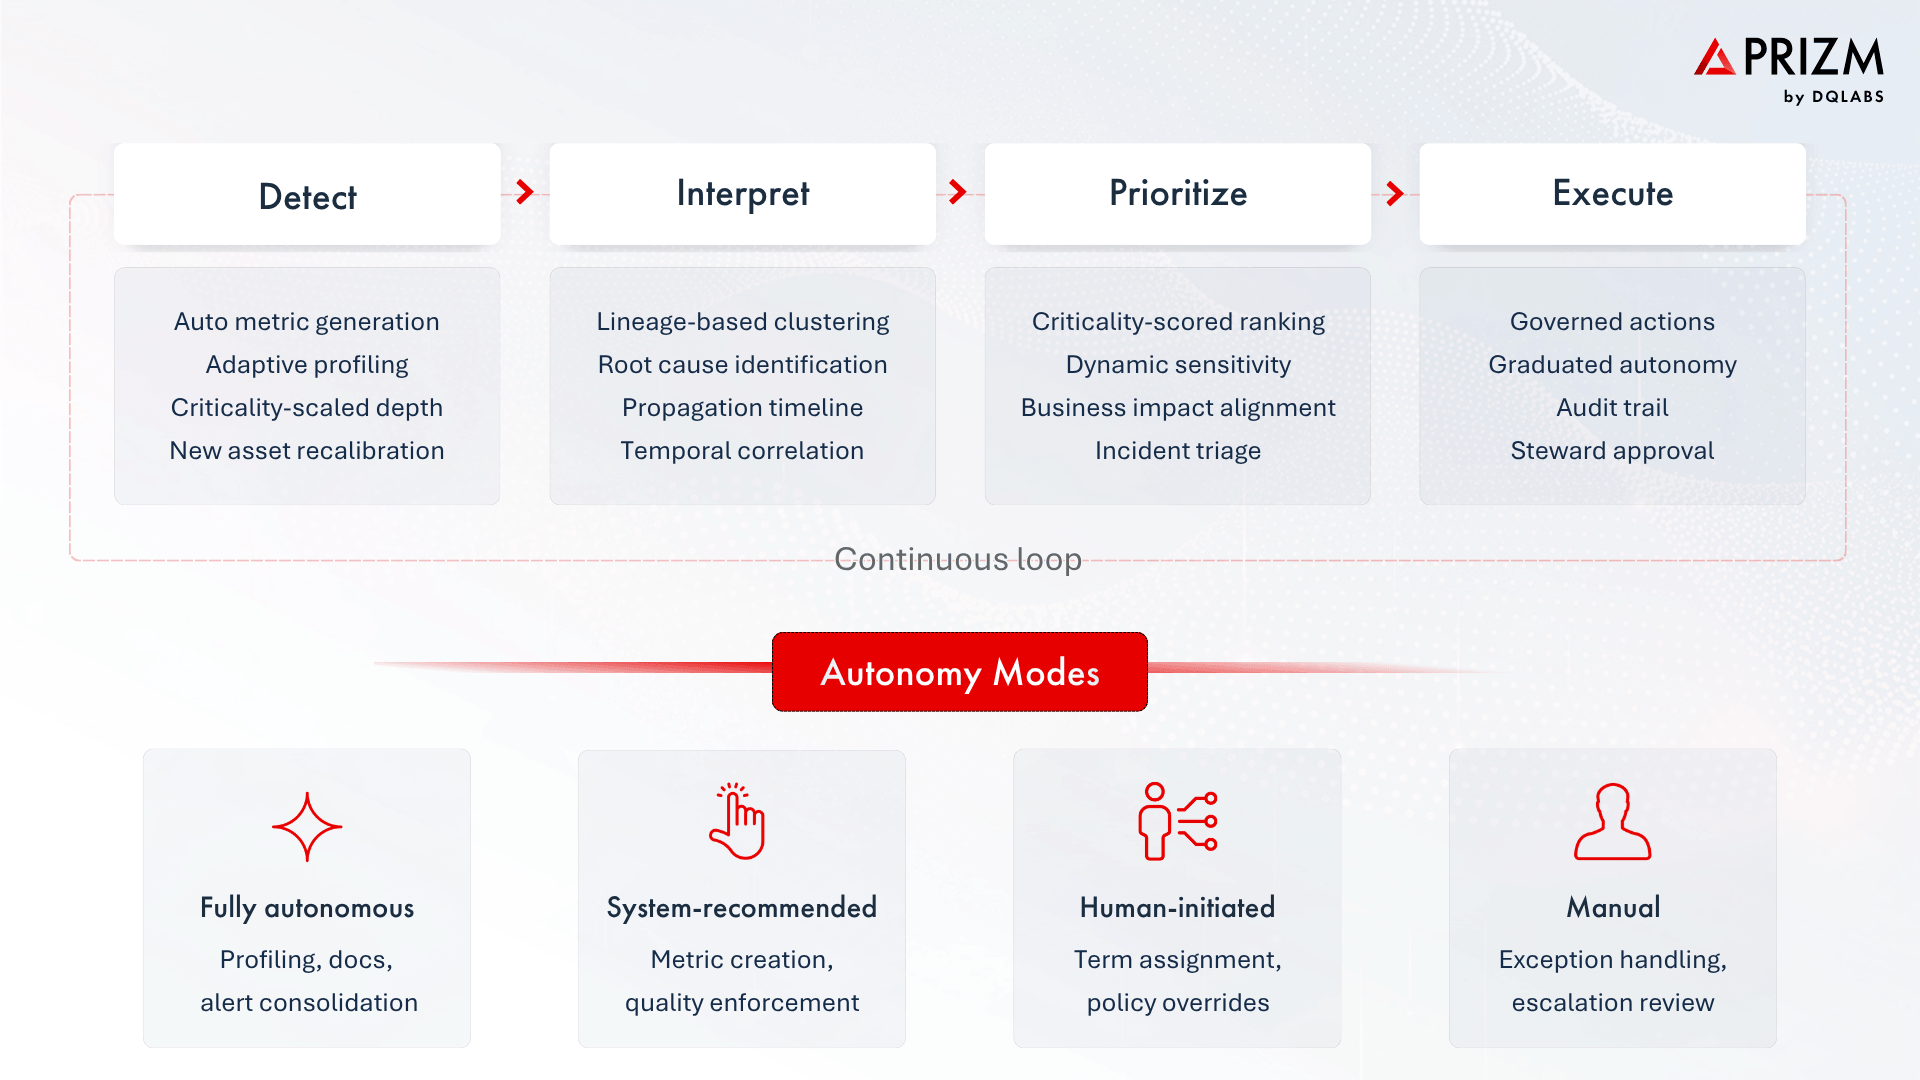
The shift at each stage is structural. Detection stops relying on manually configured rules and starts generating metrics based on the asset’s data type and criticality—operational metrics for volume, freshness, and schema; quality metrics for null rates, distributions, and statistical measures. When a new asset appears, the system calibrates coverage without waiting for an engineer to define checks.
Interpretation stops being a human task. The system connects signals through lineage and temporal proximity, producing a single incident where an engineer previously had to reconstruct one from logs and Slack threads. Prioritization stops being subjective. The system ranks incidents by the criticality of the affected assets, not by the order in which alerts arrived.
Execution stops being external to the system. Corrective actions operate within governance boundaries across graduated autonomy levels—from fully autonomous profiling and documentation to human-approved metric creation and quality enforcement. Every action, regardless of mode, is logged with a full audit trail.
At this point, observability stops being a reporting layer. It becomes the operational system that maintains data reliability—detecting, explaining, and resolving issues within the same boundary where they occur.
Operationalising the Shift: An Adoption Framework
The transition to autonomous data systems does not occur through feature adoption. It requires staged restructuring of how observability is implemented and operated. Most organisations already possess partial capabilities across detection, monitoring, and quality enforcement, but these exist as disconnected layers that do not share state.
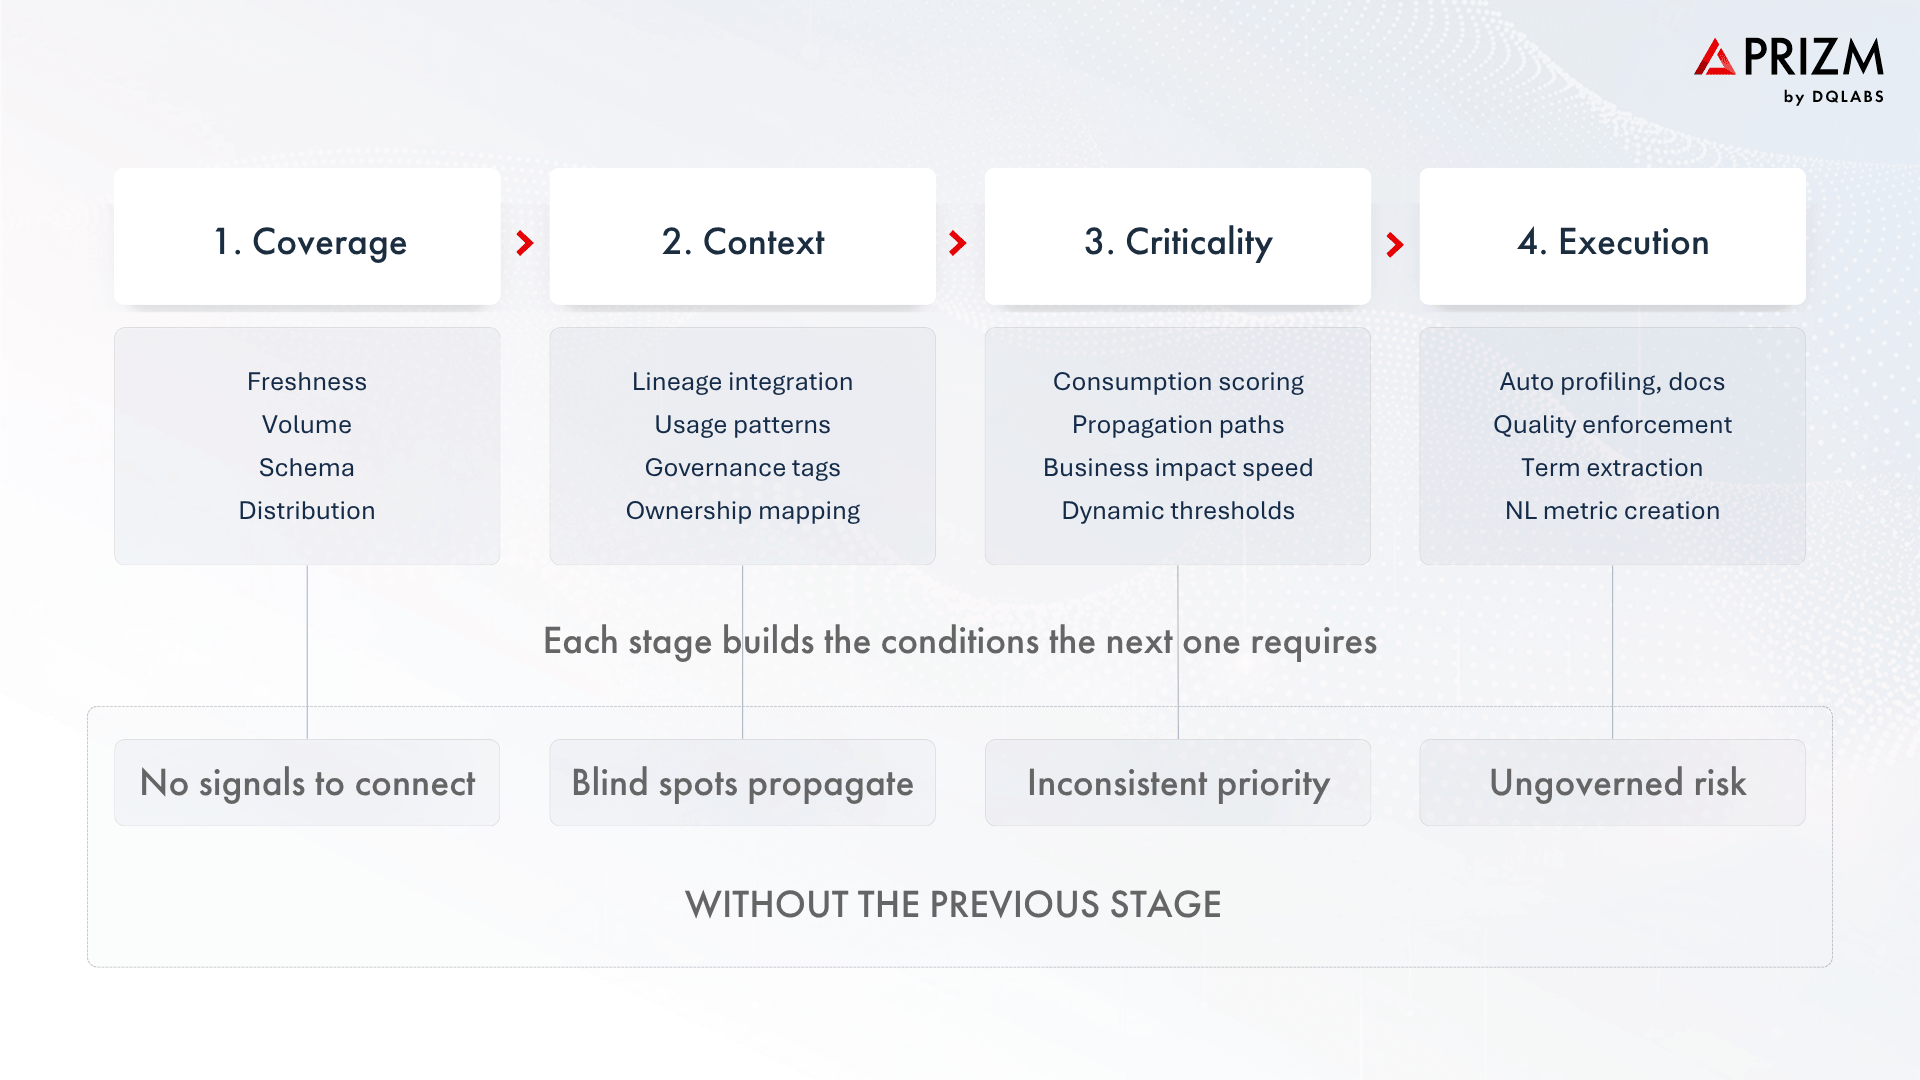
This progression is dependency-driven, not optional sequencing. Execution without prioritization creates risk. Prioritization without context creates inconsistency. Context without coverage creates blind spots.
The Convergence into a Unified Control Plane
Observability, data quality, and governance have historically been implemented as separate tools because they were built by separate vendors for separate buyers. The separation reflects procurement history, not operational logic.
All three depend on the same underlying structures. Observability requires lineage and usage to interpret signals. Quality requires the same context to set expectations and validate them. Governance requires both to enforce policy, trace accountability, and manage business semantics. When each tool reconstructs this context independently, the result is duplication, inconsistency, and slower resolution.
The emerging model consolidates these functions into a single platform that ingests metadata once, constructs a contextual graph of dependencies and usage once, and makes that graph available to observability, quality, and governance as coordinated functions. Observability provides continuous awareness. Quality enforces expectations dynamically. Governance ensures traceability and compliance. Context and criticality are shared across all three, not rebuilt for each.
Conversational Accessibility
This architecture also enables interaction models that were not possible with fragmented tools. A natural language interface grounded in the platform’s full context can serve as a single source of truth. It can answer questions about domain health, recommend business metrics, extract governance terms from uploaded policy documents, generate documentation, and create quality checks—all within a single conversational thread. The same capabilities extend to external AI tools through protocol integrations, so users can query the system from their existing environment without switching applications.
Market Implications
The forces driving this transition are not preferences. They are constraints.
AI-driven consumption requires continuous trust in data inputs. Models and agents act on incoming data immediately—no human validation step, no buffer window. Errors propagate directly into decisions, pricing, and regulatory submissions. System scale compounds the problem: the number of data assets and interdependencies in a typical enterprise is growing faster than the teams responsible for managing them, and the portion of data that is manually validated remains a fraction of what is consumed. That gap cannot be closed by hiring.
Fragmented architectures make it worse. When observability, quality, and governance operate as separate tools, no single system owns the lifecycle of a data issue. Detection happens in one place, interpretation in another, resolution in a third. Latency accumulates at every handoff.
These pressures are shifting how the market evaluates next-generation platforms. The criteria are moving from detection coverage—how many anomalies a tool can find—to operational outcomes: how fast signal noise collapses into incidents, how accurately prioritization reflects business impact, and how much of the resolution loop the system can close without human intervention.
Data observability, in this context, becomes the control plane for data operations. Platforms that internalise this model will not appear as incremental upgrades. They will define the operating standard.
Prizm by DQLabs: From Observability to Autonomous Data Operations
The direction described in this article is not theoretical, Prizm by DQLabs is built around it.
Prizm extracts metadata across warehouses, transformation layers, and BI tools to construct a live contextual graph of the data landscape. Criticality is calculated continuously from usage, lineage, freshness sensitivity, and governance state—and that score governs downstream system behaviour: profiling depth, metric deployment, alert severity, and resolution priority all follow from it.
When alerts arrive, the platform clusters them against lineage and temporal data, resolving what would otherwise be dozens of notifications into a single incident with a root cause, a propagation path, and remediation guidance. Every action the platform takes—whether autonomous or human-approved—is tracked with a full audit trail across graduated autonomy modes.
Prizm also shifts how users interact with data operations. Instead of navigating screens, users work through a conversational interface that can answer questions, create metrics, generate documentation, and build quality checks in natural language. The same capabilities extend to external AI tools through protocol integrations, in any language.
As data ecosystems continue to scale, the distance between detecting an issue and resolving it is what separates operational platforms from reporting tools. Prizm is designed to close that distance.