
As data architectures grow more distributed and AI-dependent, the cost of undetected pipeline failures is no longer a minor inconvenience — it is an existential risk to analytics trust, model reliability, and business outcomes.
Summarize and analyze this article with
The Shifting Landscape of Data Infrastructure
Modern data ecosystems look nothing like the monolithic ETL environments of five years ago. The rise of ELT workflows, Lakehouse architectures, and AI-native pipelines has distributed data processing across dozens of systems, tools, and teams. By 2026, over 85% of enterprises are using or planning to adopt data Lakehouse architectures, blending the scalability of data lakes with the governance rigor of warehouses.
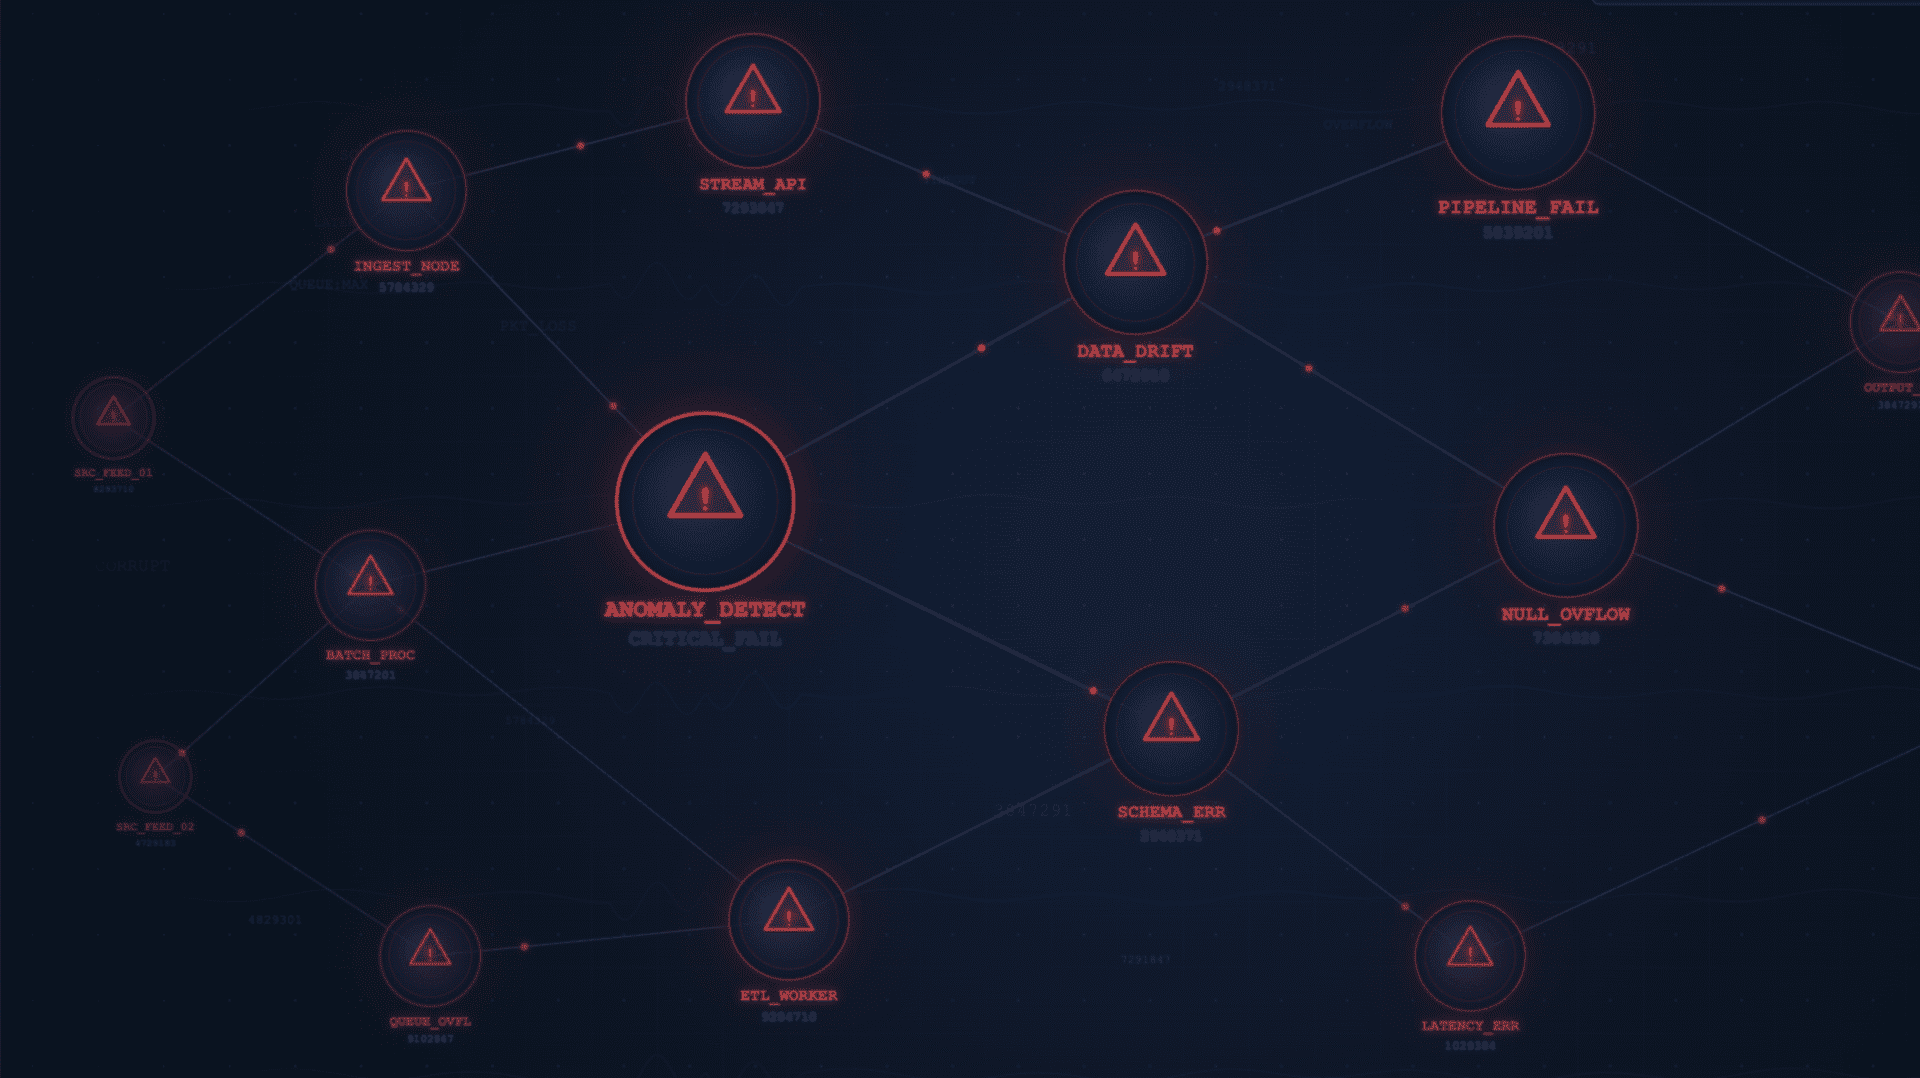
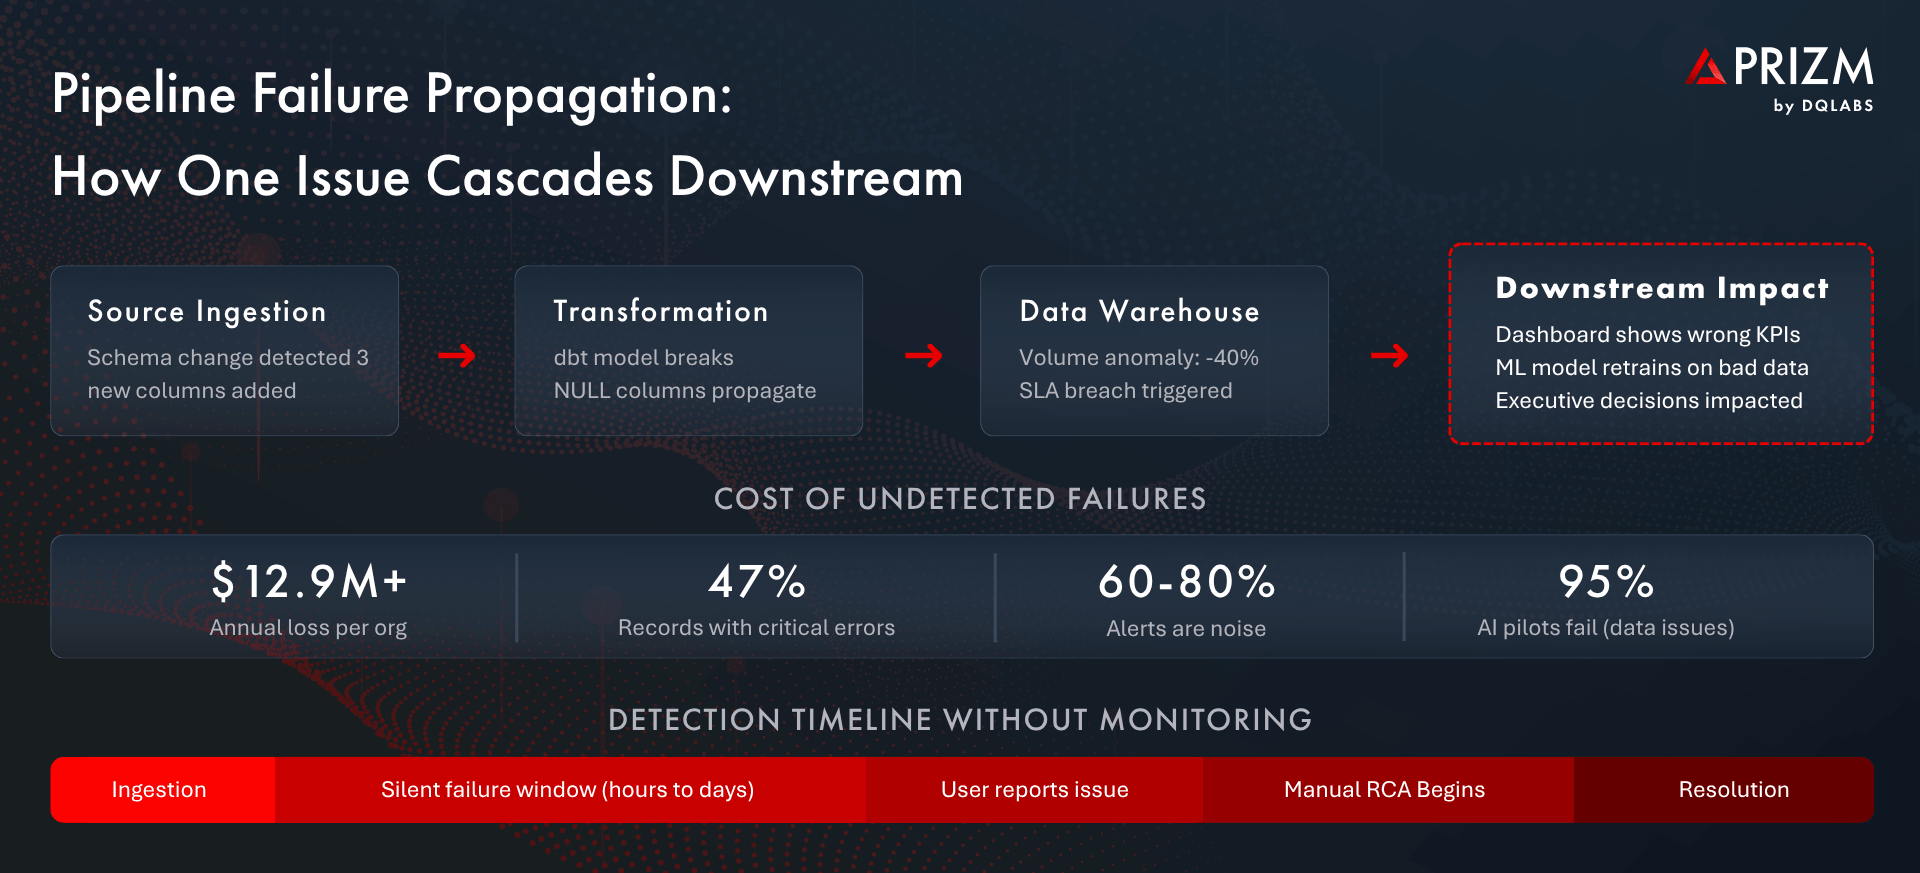
This evolution has introduced extraordinary capability — and extraordinary fragility. Every pipeline now feeds into a dependency chain: ingestion stages feed transformation layers, which feed analytical models, which feed dashboards and machine learning systems that drive real-time business decisions. A single schema change at the source can cascade silently through this chain, corrupting reports, retraining models on bad data, and eroding stakeholder confidence long before anyone notices.
The numbers are sobering. Gartner reports that organizations lose more than $12.9 million annually to poor data quality. Harvard Business Review estimates the broader cost to U.S. businesses at $3.1 trillion per year. And in the AI domain, MIT’s latest research shows that approximately 95% of enterprise generative-AI pilot projects fail to deliver measurable impact — with data pipeline and quality failures as the leading cause.
The implication is clear: you cannot build reliable analytics or trustworthy AI on pipelines you do not continuously observe.
What Is Data Pipeline Monitoring?
Data pipeline monitoring is the practice of continuously observing every stage of the data lifecycle — from ingestion through transformation, loading, and consumption — to ensure data arrives on time, in the right shape, at the expected volume, and with the integrity that downstream systems require.
This goes far beyond checking whether a job succeeded or failed. Modern pipeline monitoring evaluates multiple dimensions simultaneously:
- Freshness: Is data arriving within its expected SLA window? A dashboard that shows yesterday’s revenue as today’s is silently misleading every stakeholder who views it.
- Volume: Are row counts and data volumes consistent with historical patterns? A 40% drop in records may not trigger a job failure, but it will produce deeply unreliable analytics.
- Schema Integrity: Have column types, names, or structures changed upstream without notice? Undetected schema drift is one of the most common causes of silent pipeline breakage.
- Completeness: Are null rates, missing fields, or partial loads within acceptable bounds? Incomplete data fed into AI models produces biased or inaccurate outputs.
- Distribution: Do value distributions match expected statistical profiles? A sudden shift in a column’s mean or variance often signals an upstream data-generation problem.
- Latency and SLA Compliance: How long does data take to traverse the pipeline end to end, and are processing-time commitments being met?
Effective pipeline monitoring operates across all four stages of the data lifecycle: ingest (source connectivity, extraction health), transform (model execution, logic correctness), load (warehouse delivery, partition integrity), and output (dashboard refresh, API availability, model serving).
Why Pipeline Monitoring Is Crucial Now
Several reasons have converged to make automated pipeline monitoring non-negotiable for any organization that depends on data for decisions or AI.
Trust Erosion Is the Highest Cost
When a finance team discovers that the revenue dashboard was wrong for three days, the damage extends far beyond a single metric. Stakeholders lose confidence in the entire data platform. Rebuilding that trust takes months — and meanwhile, teams revert to spreadsheets and manual checks, undermining every investment made in modern data infrastructure.
AI Amplifies Data Quality Failures
Machine learning models are only as reliable as the data they train on. When pipeline failures introduce stale, incomplete, or shifted data into feature stores and training sets, models degrade silently. Unity Technologies disclosed that corrupted ingestion data cost the company approximately $110 million in lost revenue from underperforming advertising models — a failure that was invisible until business outcomes deteriorated.
Compliance and Governance Demand Traceability
Regulatory frameworks increasingly require organizations to demonstrate data lineage and quality for AI-driven decisions. Without continuous monitoring, proving that the data feeding a credit-scoring model or fraud-detection system was timely, complete, and accurate becomes an exercise in retroactive forensics rather than operational assurance.
Manual Approaches Do Not Scale
Many data teams still rely on custom SQL checks, ad-hoc dbt tests, or periodic spot-checks to validate pipeline health. These approaches cover only the pipelines someone thought to test, miss emergent failure patterns, and consume engineering time that should be spent building value. With the average enterprise operating hundreds of pipelines across multiple orchestrators, manual monitoring creates dangerous blind spots.
What Is Anomaly Detection in Data Pipelines?
Anomaly detection applies machine learning, statistical modeling, and adaptive rules to automatically identify unexpected behavior across pipeline metrics — without requiring engineers to predefine every possible failure mode.
Where traditional monitoring asks “did this metric cross a threshold I set?”, anomaly detection asks “does this behavior look normal given everything we know about this data, this entity, and this time window?” The distinction is critical. Static thresholds generate noise; intelligent baselines generate signal.
How Modern Anomaly Detection Works
- Automated Baseline Creation: The system learns normal patterns for every monitored metric — volume, freshness, null rates, distribution shape — by analyzing historical data. No manual threshold configuration is required.
- Seasonal and Temporal Awareness: Anomaly models account for time-of-day, day-of-week, month-end, and holiday patterns. A volume drop on a Sunday is not the same signal as a volume drop on a Tuesday.
- Entity-Aware Thresholds: Rather than applying one threshold globally, the system creates separate baselines for each table, column, or pipeline segment. What is normal for a high-volume transactions table is very different from a slowly-updating reference table.
- Distribution Drift Detection: Beyond simple counts, the system monitors the statistical properties of data values — detecting shifts in mean, variance, cardinality, or categorical frequency that indicate upstream changes.
- Contextual Alerting: Anomalies are not surfaced in isolation. Each alert carries context: which asset is affected, what downstream consumers depend on it, how critical it is, and whether related anomalies are occurring simultaneously.
The measurable impact is significant. Organizations adopting ML-powered anomaly detection report a 49% reduction in mean time to detection (MTTD) compared to threshold-based approaches, with false positive rates decreasing by 37–42%. This means data teams spend less time investigating noise and more time resolving real issues.
Key Challenges Without Pipeline Monitoring and Anomaly Detection
Organizations that lack automated pipeline observability face a predictable set of compounding problems:
- Alert Fatigue: Static threshold alerts generate hundreds of notifications daily, with 60–80% being noise. Engineers stop responding, and critical alerts get buried. The result is worse than having no alerting at all — it creates a false sense of coverage.
- Delayed Detection: Without continuous automated monitoring, most pipeline issues are discovered when a business user complains — hours or days after the failure occurred. The silent failure window is where the most expensive damage happens.
- Manual Root Cause Analysis: Once an issue is detected, engineers spend hours tracing it through logs, query histories, and Slack threads. Without automated lineage-aware RCA, a problem that takes 15 minutes to diagnose with the right tooling can consume an entire day of engineering time.
- No Downstream Impact Awareness: Traditional monitoring tells you that a job failed, but not what it means. Without understanding which dashboards, models, and stakeholders are affected, teams cannot prioritize effectively.
- Engineering Burnout and Trust Degradation: Constant firefighting exhausts data teams, reduces their capacity for strategic work, and creates a cycle where poor observability leads to more incidents, which leads to more firefighting.
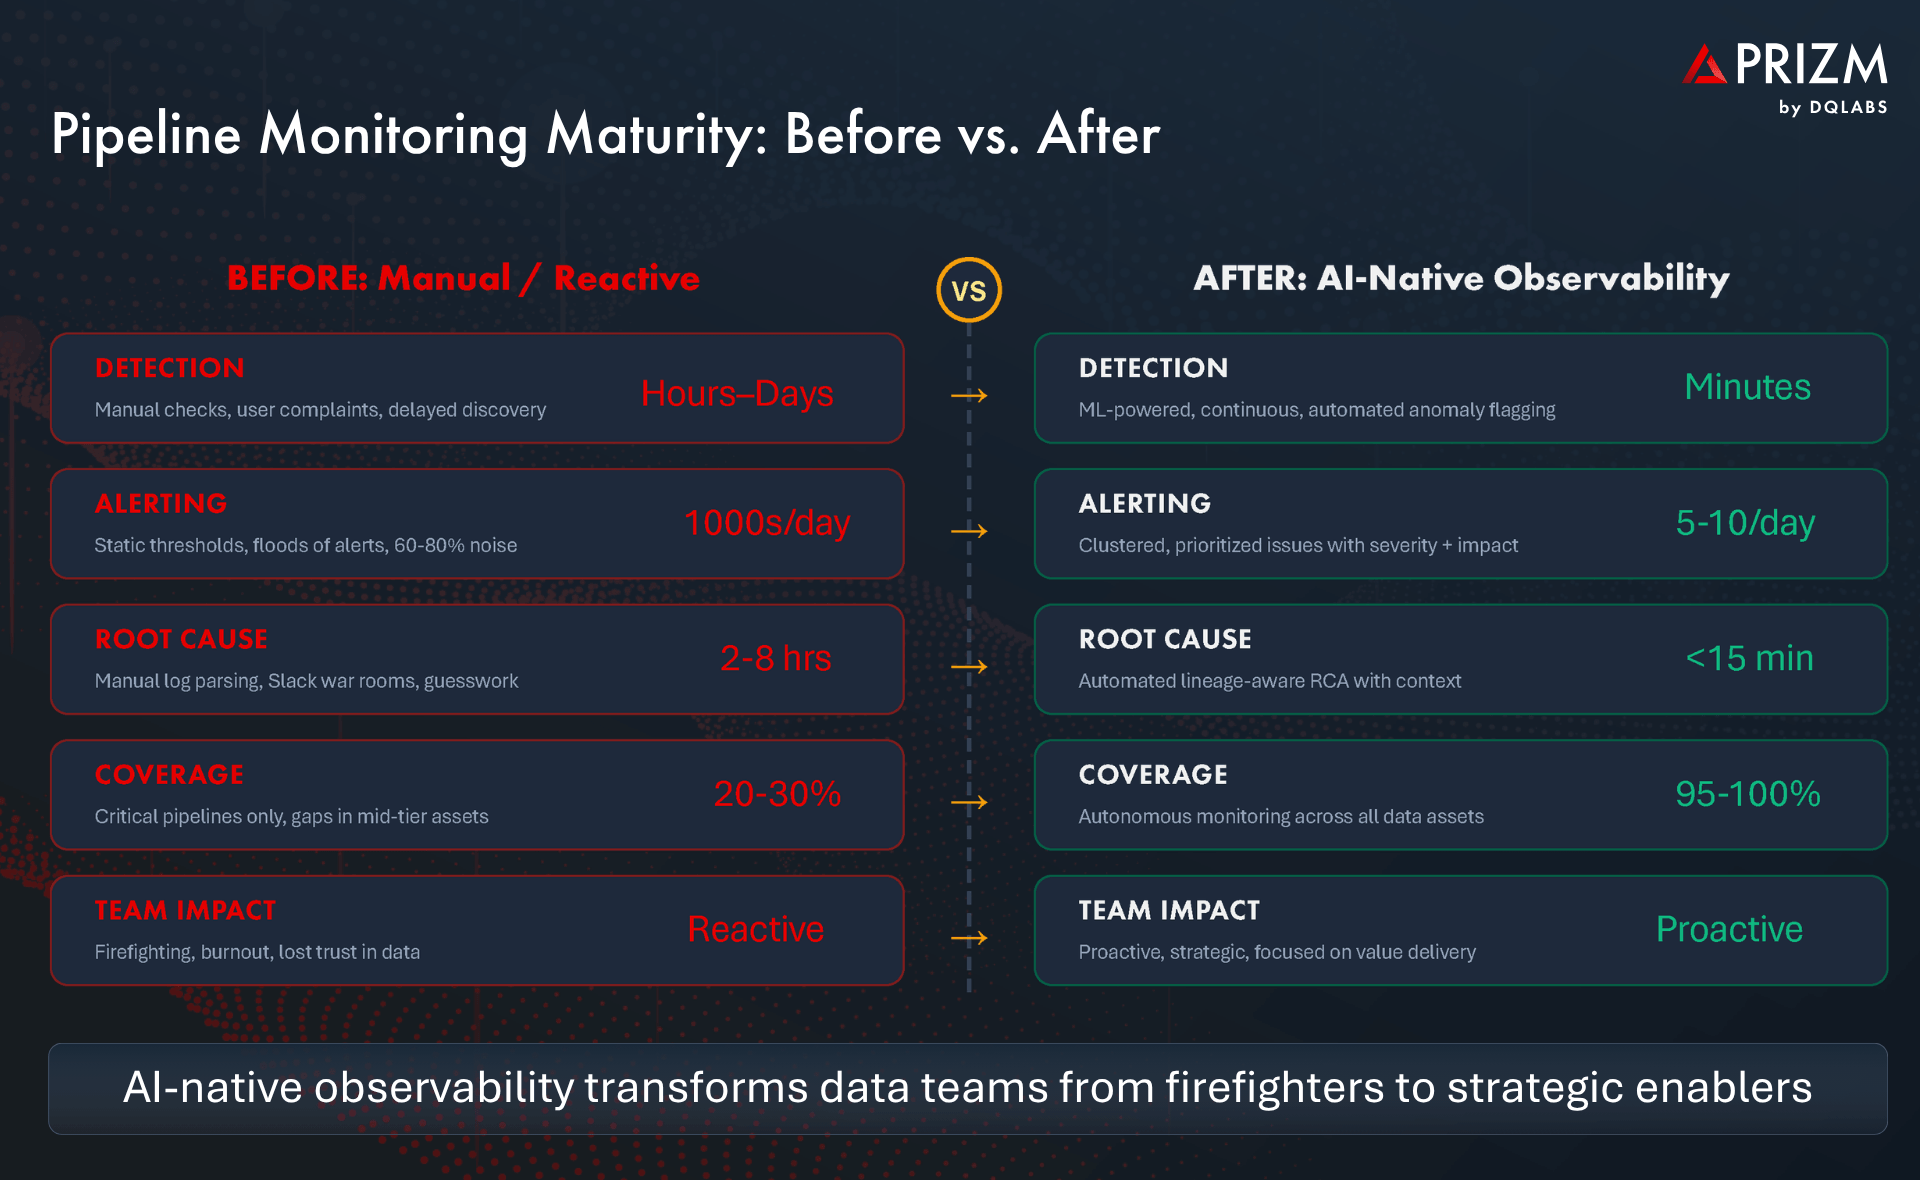
How Modern Platforms Solve This
AI-native observability platforms like Prizm by DQLabs addresses these challenges through a fundamentally different approach — one that combines autonomous detection, contextual intelligence, and closed-loop resolution.
Autonomous Issue Detection
Rather than waiting for engineers to configure checks, modern platforms automatically monitor metadata signals across every connected data asset. When an anomaly is detected in freshness, volume, schema, or distribution, the platform evaluates it against the asset’s lineage, usage patterns, domain context, and criticality to determine whether it represents a genuine issue.
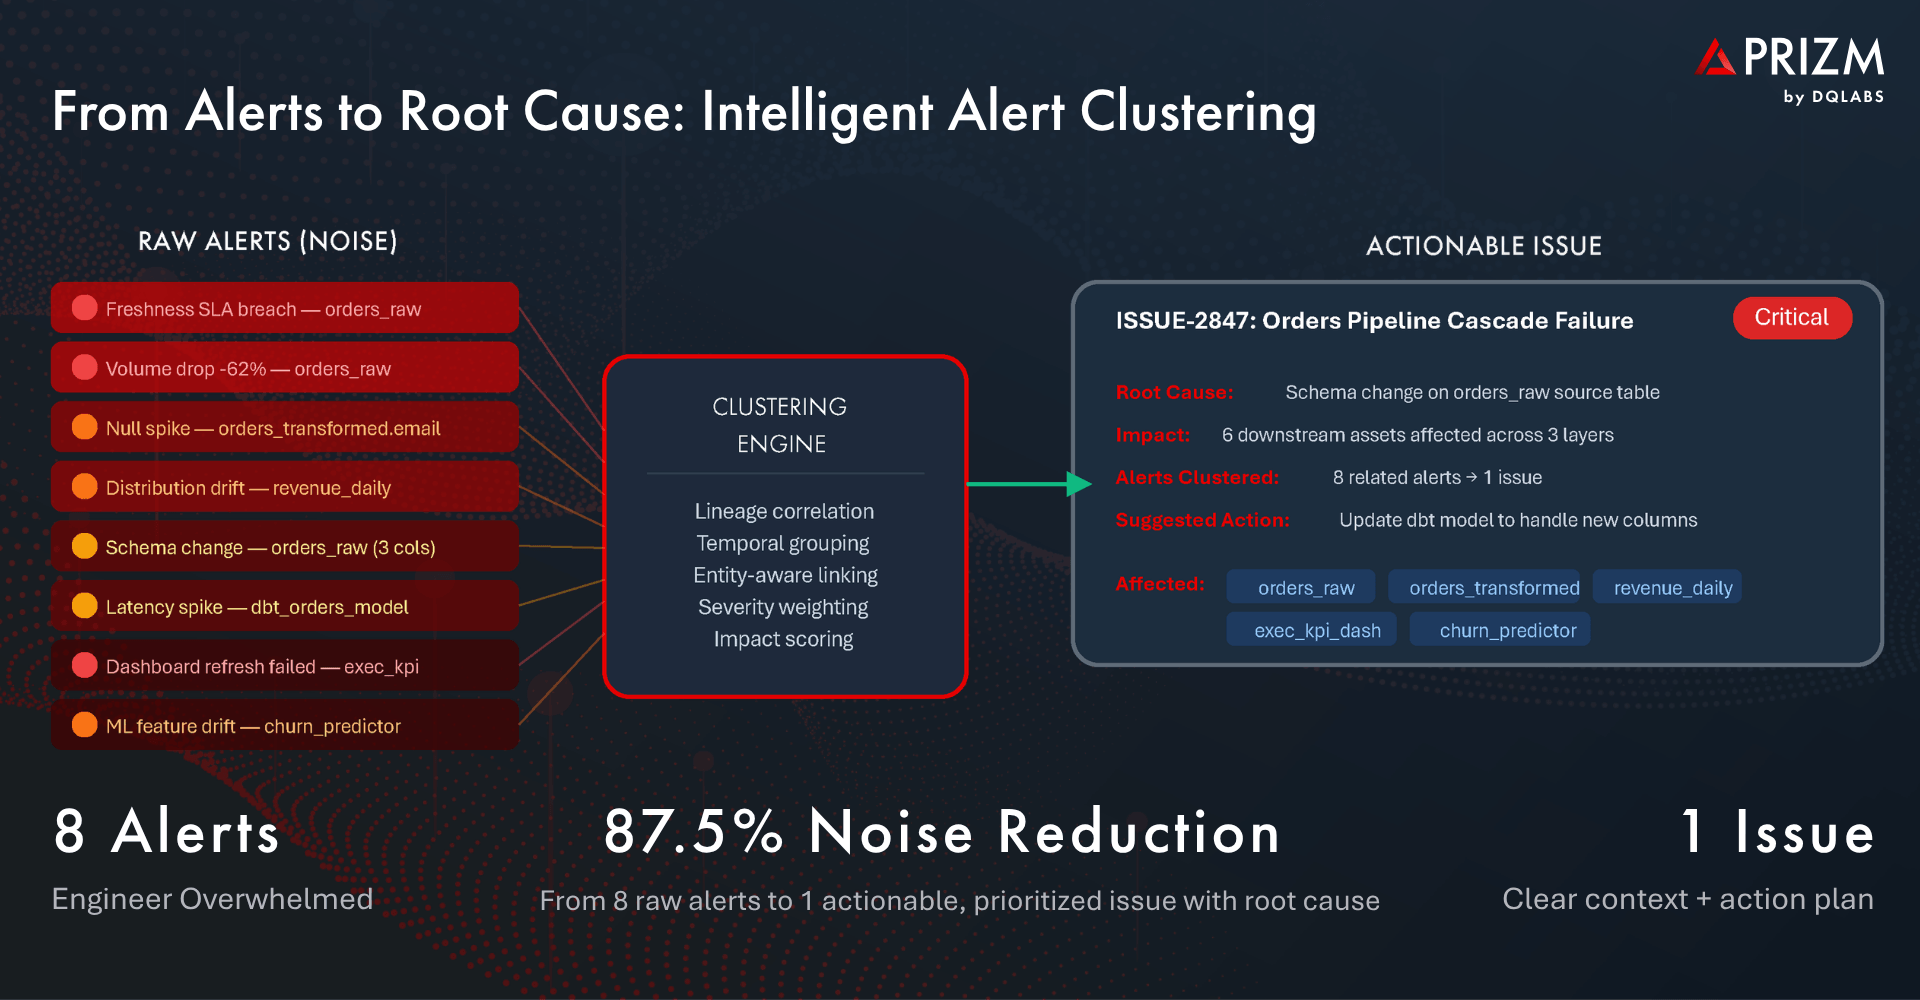
Intelligent Alert Clustering and Prioritization
Raw anomalies are grouped into consolidated issues using lineage correlation, temporal proximity, and entity relationships. Eight related alerts become a single, prioritized issue with a clear severity score, root cause hypothesis, and impact assessment. This is the difference between an engineer receiving a wall of Slack notifications and receiving one actionable ticket that says: “Schema change on orders_raw caused a cascade failure affecting 6 downstream assets, including the executive KPI dashboard.”
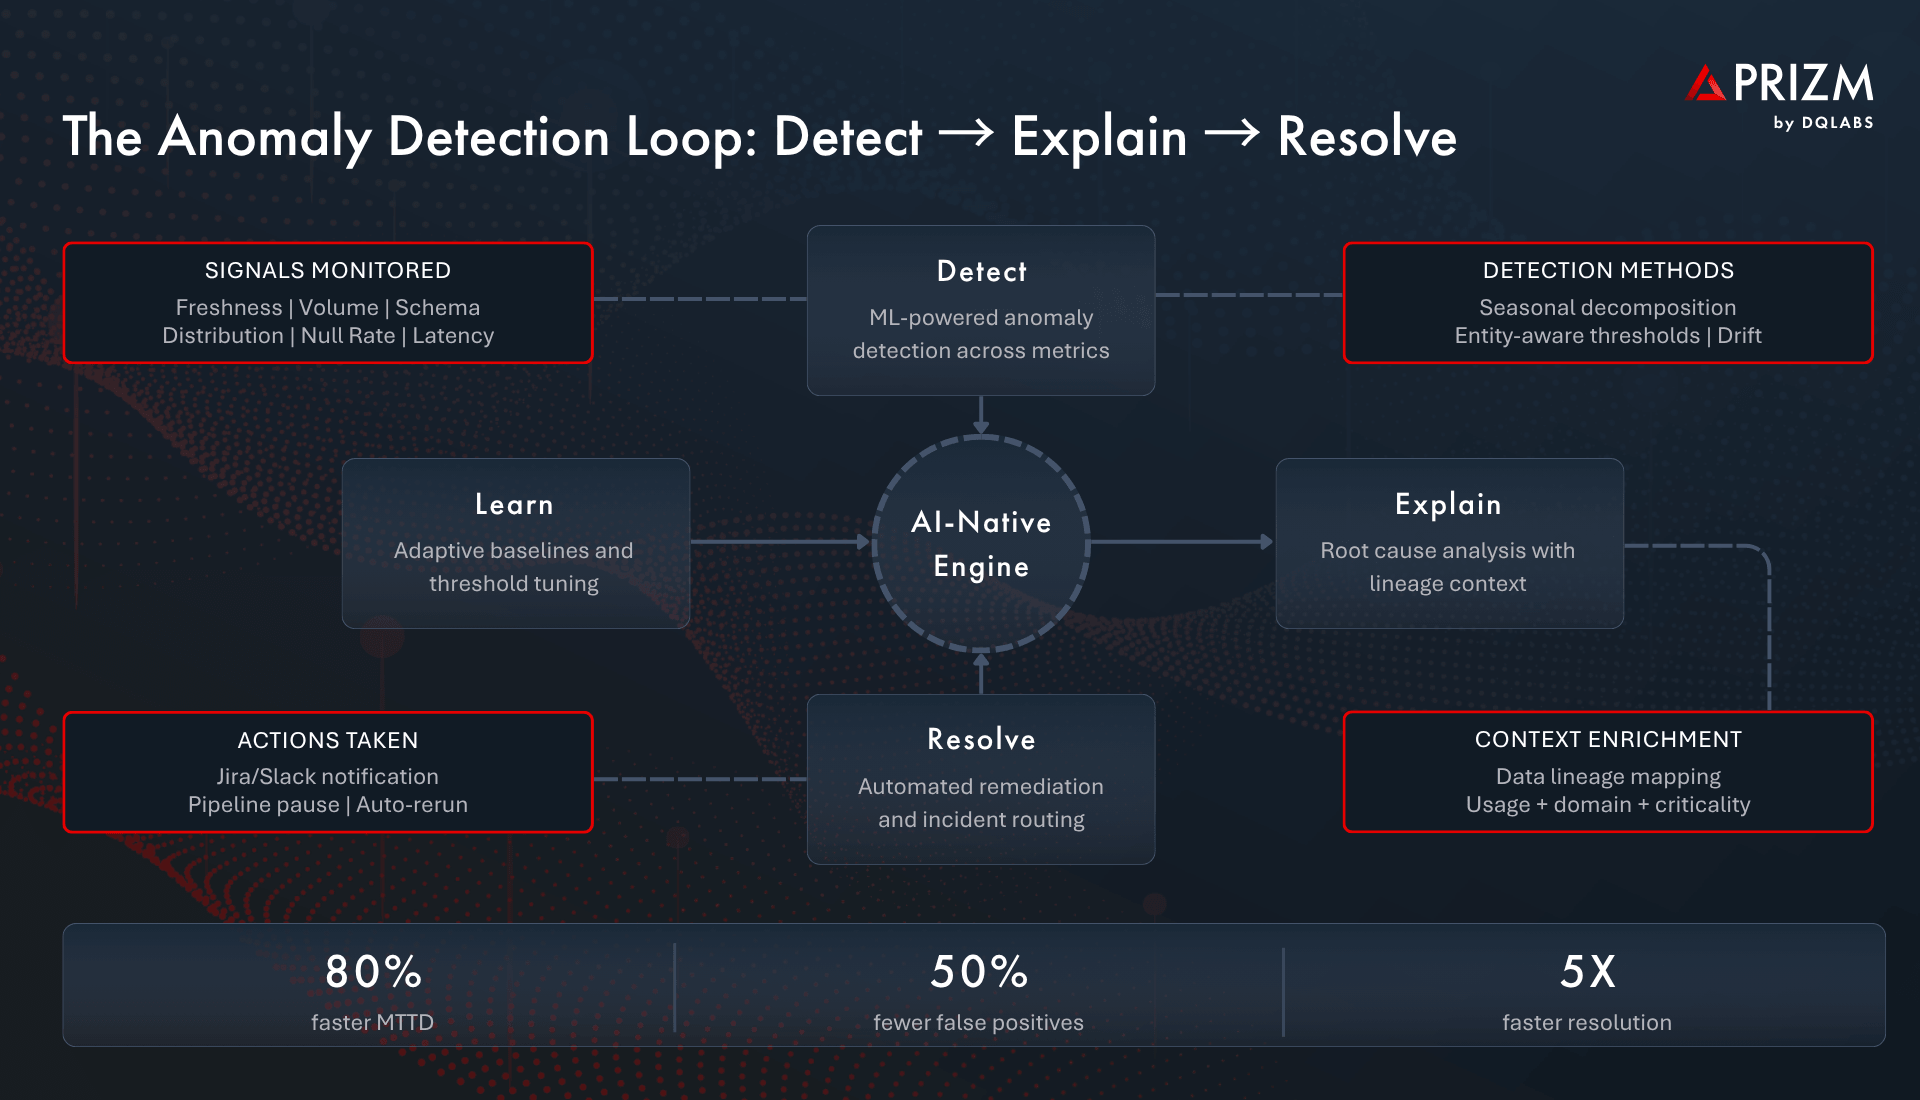
The Detect → Explain → Resolve Loop
Modern platforms operationalize a continuous loop: detect anomalies automatically, explain them using lineage and context, and resolve them through integrated workflows — whether that means creating a Jira ticket, notifying a Slack channel, triggering a pipeline rerun, or pausing a downstream model refresh. This loop continuously improves as the system learns from resolved incidents.
Deep Integration with the Data Stack
Effective observability does not exist in isolation. Modern platforms integrate natively with orchestration tools like Airflow and dbt, data catalogs, lineage systems via OpenLineage, and incident management platforms. This means anomalies are detected where data moves, context is enriched from where data is documented, and resolution happens where engineers already work.
Embedded AI Agents
The most advanced platforms deploy autonomous AI agents that continuously monitor DDL/DML changes, compute operational metrics, and trigger governance workflows without human intervention. These agents adapt their baselines as data patterns evolve, reducing configuration drift and ensuring monitoring stays accurate over time.
The Business and AI Impact
The return on investing in pipeline monitoring and anomaly detection is both measurable and compounding:
- Pipeline Reliability Drives Better Decisions: When data teams can guarantee freshness and completeness SLAs, business stakeholders make decisions with confidence rather than caveats. The time from question to trusted answer shrinks dramatically.
- AI Models Perform on Clean, Timely Data: With continuous monitoring ensuring feature stores and training pipelines deliver high-quality data, model accuracy improves, retraining cycles become predictable, and the risk of silent model degradation drops significantly.
- Compliance Posture Strengthens: Automated observability creates a continuous audit trail of data health, making it straightforward to demonstrate compliance with data governance policies and regulatory requirements.
- Data Teams Reclaim Strategic Capacity: By reducing MTTD and MTTR and eliminating false-positive noise, engineers spend less time firefighting and more time building the data products that differentiate the business. Teams that adopt intelligent observability report reducing incident response time by 3x or more.
Frequently Asked Questions
What is data pipeline monitoring?
Data pipeline monitoring is the continuous, automated observation of data as it flows through ingestion, transformation, loading, and consumption stages. It tracks metrics like freshness, volume, schema integrity, completeness, and distribution to detect issues before they impact downstream analytics or AI systems.
How does anomaly detection differ from traditional threshold-based alerting?
Traditional alerting requires engineers to manually set static thresholds for each metric, which generates excessive false positives and misses novel failure patterns. Anomaly detection uses machine learning to automatically learn normal behavior patterns for each entity, adapting to seasonal variations, entity-specific baselines, and evolving data characteristics — resulting in significantly fewer false alerts and faster detection of genuine issues.
What is alert fatigue and why does it matter for data teams?
Alert fatigue occurs when data engineers receive so many low-signal notifications that they begin ignoring alerts entirely. Research shows 60–80% of pipeline alerts are noise. This is dangerous because critical issues get lost in the flood, leading to longer detection times, slower resolution, and degraded trust in the monitoring system itself.
How does pipeline monitoring impact AI and machine learning systems?
AI models are extremely sensitive to input data quality. Pipeline monitoring ensures that feature stores and training datasets receive fresh, complete, and statistically consistent data. Without it, models can silently degrade as they train on stale, incomplete, or drifted data — leading to poor predictions and costly business outcomes.
What is root cause analysis in data observability?
Root cause analysis (RCA) is the process of tracing a detected anomaly back to its origin point in the data pipeline. Modern observability platforms automate this using data lineage, correlating related anomalies across the dependency chain to identify the single upstream event that triggered downstream failures — reducing manual investigation time from hours to minutes.
What metrics should data teams monitor across their pipelines?
The core metrics include freshness (data timeliness relative to SLAs), volume (row count consistency), schema integrity (structural changes), completeness (null rates and missing values), distribution (statistical properties of data values), and latency (end-to-end processing time). Together, these dimensions provide comprehensive visibility into pipeline health.
How does intelligent alert clustering reduce noise?
Alert clustering uses data lineage, temporal correlation, and entity relationships to group multiple related alerts into a single consolidated issue. For example, a schema change that triggers eight separate alerts across different pipeline stages is presented as one prioritized issue with a clear root cause and impact assessment — reducing noise by 80–90% while preserving signal.
About DQLabs
DQLabs is the provider of Prizm, the industry’s first AI-native, self-driving platform for data observability, quality and context. Prizm delivers autonomous anomaly detection, intelligent alert clustering, lineage-aware root cause analysis, and embedded AI agents that continuously learn and adapt — enabling data teams to move from reactive firefighting to proactive, scalable data reliability.