

Summarize and analyze this article with
You invested in data observability. The monitors are running. The alerts are flowing. So why does your data team feel more overwhelmed than ever — and why are critical issues still slipping through?
How Data Pipeline Observability Works — And Where It Goes Right
Data pipeline observability is the practice of continuously monitoring data as it moves through ingestion, transformation, loading, and consumption. Modern observability platforms track a core set of metrics across every stage of the pipeline to detect problems before they impact business decisions and AI systems.
The key metrics that form the backbone of pipeline observability include freshness (is data arriving on schedule?), volume (are row counts consistent with historical patterns?), schema integrity (have columns, types, or structures changed upstream?), completeness (are null rates and missing values within bounds?), distribution (do value profiles match expected statistical shapes?), and latency (is end-to-end processing time meeting SLAs?). Together, these dimensions provide a comprehensive picture of pipeline health across every layer of your data stack.
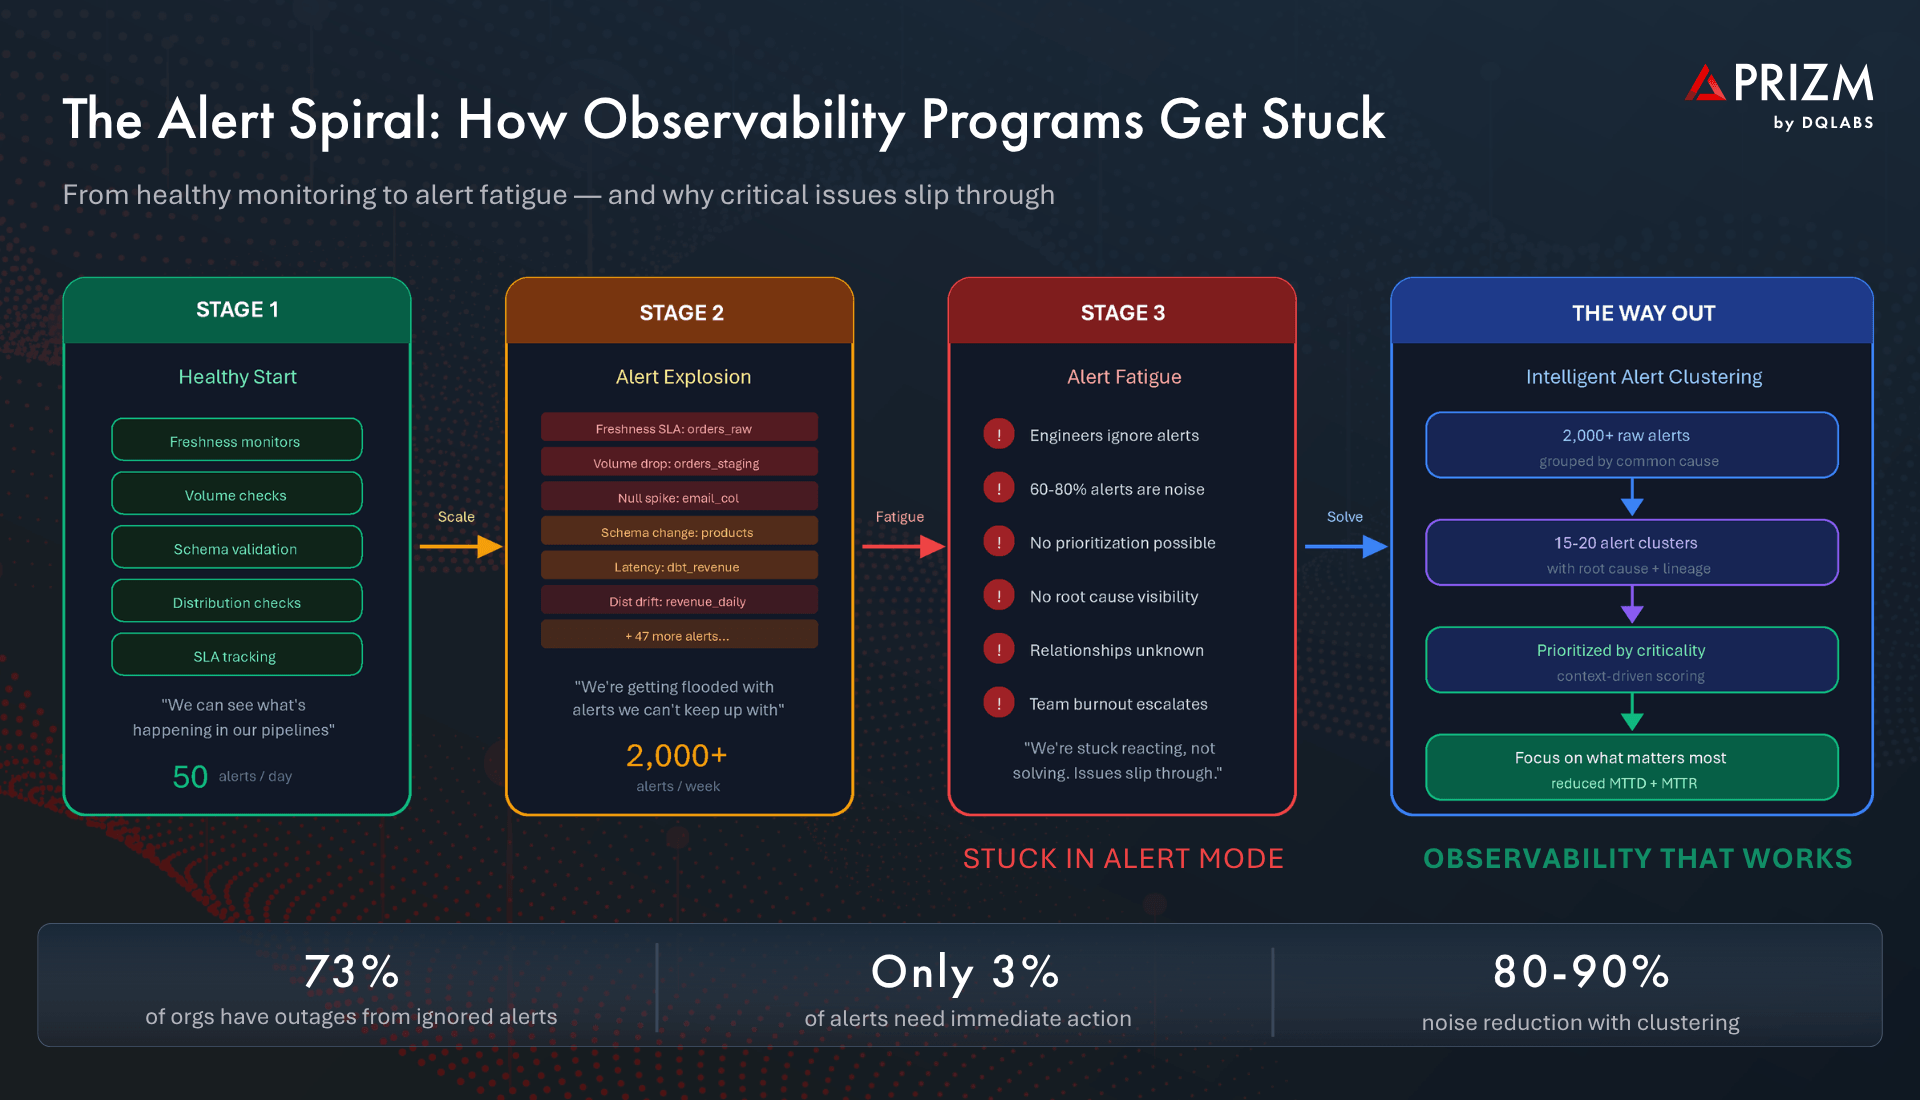
When implemented well, observability gives data teams the visibility they never had before. Engineers can see freshness SLA breaches before stakeholders complain. Volume anomalies surface within minutes rather than days. Schema changes that would have silently broken downstream models are flagged automatically. This is observability working as intended — and for a brief moment, it feels like the problem is solved.
But then something predictable happens: the alerts start multiplying.
The Alert Explosion: When Observability Creates a New Problem
As organizations scale their observability programs from a handful of critical pipelines to hundreds or thousands of monitored assets, the volume of alerts grows exponentially. Research shows that data engineering teams receive over 3,000 alerts per week, with only 5-10% requiring immediate action. The rest is noise — low-severity distribution drifts, expected weekend volume dips, or cascading symptoms of a single upstream issue that fires 40 separate notifications across downstream tables, models, and dashboards.
This is the paradox of observability: the very system designed to give you control starts taking it away. Engineers who were hired to build data products now spend their mornings scrolling through Slack channels and email threads trying to figure out which of last night’s 200 alerts actually matter. A single schema change at the source triggers a cascade of freshness, volume, null rate, and distribution alerts across every downstream asset — each one looking like a separate incident when it is, in reality, one root cause with many symptoms.
The result is a data team that is always busy but never in control. And the most dangerous part? Critical issues start hiding in the noise. A revenue-impacting data freshness failure sits at alert number 147 in the queue, buried behind dozens of low-priority warnings that no one has time to triage.
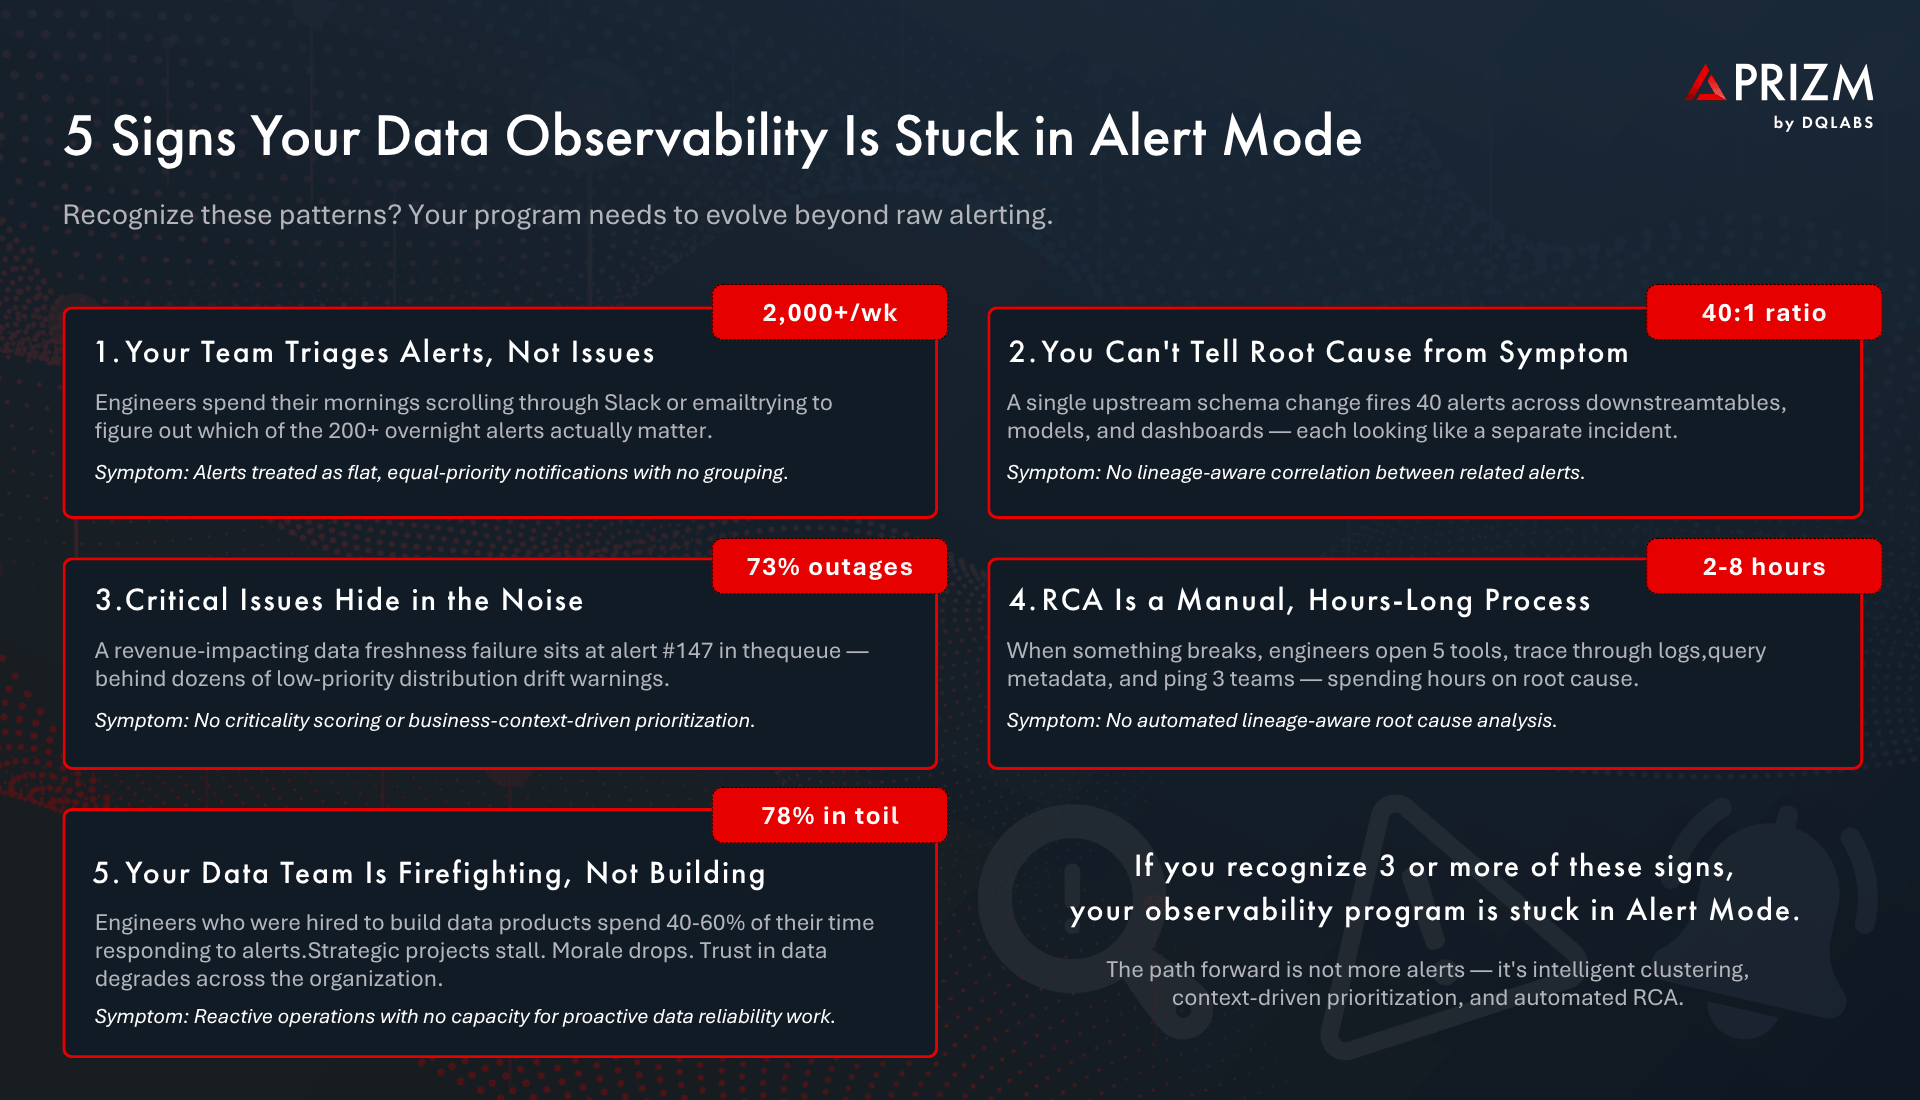
5 Signs Your Observability Program Is Stuck in Alert Mode
Sign 1: Your Team Triages Alerts, Not Issues
If your data engineers start each day by sorting through a flat list of individual alerts — trying to determine which are related, which are duplicates, and which are genuinely new — your observability program is generating noise, not insight. Alerts are treated as equal-priority, independent events with no grouping or correlation. The team is triaging alerts rather than resolving the issues that caused them.
Sign 2: You Cannot Tell Root Cause from Symptom
A single upstream change fires dozens of alerts across the dependency chain. Without lineage-aware correlation, each alert looks like a separate problem. Engineers investigate the same root cause five different times from five different angles — wasting hours of effort on what should have been a single, linked investigation. The ratio of alerts to actual root causes can exceed 40:1 in complex pipeline environments.
Sign 3: Critical Issues Hide in the Noise
When every alert has the same visual weight in your notification channel, the one that matters most is invisible. Research shows 73% of organizations have experienced outages caused by ignored or suppressed alerts. Without criticality scoring driven by business context — understanding which assets feed executive dashboards, which power AI models, which underpin compliance reporting — there is no way to prioritize. Everything looks equally urgent, which means nothing is.
Sign 4: Root Cause Analysis Is a Manual, Hours-Long Process
When something breaks, the investigation looks like this: open the orchestration tool, check the data warehouse logs, query the metadata catalog, trace the lineage graph, and then message three different teams on Slack to understand what changed upstream. This manual RCA process consumes 2 to 8 hours per incident — time that compounds across the dozens of incidents a team handles each week. Without automated, lineage-aware root cause analysis, every incident is a detective story.
Sign 5: Your Data Team Is Firefighting, Not Building
The most telling sign is organizational. 78% of data engineers report spending 30% or more of their time on manual toil — and alert response is a major contributor. Strategic projects stall. Platform improvements get deferred quarter after quarter. Morale drops. And the broader organization loses trust in data, reverting to spreadsheets and gut instinct. The observability program that was supposed to improve reliability has instead become a source of operational drag.
Why This Problem Is Harder Than It Looks
The challenge of moving beyond alert mode is compounded by three forces that are only accelerating.
Data ecosystems are increasingly automated with no validation layer. Pipelines run on schedules, dbt models execute in sequence, and AI consumers ingest whatever data arrives — making decisions based on whatever they receive, with no human checkpoint. When bad data enters this automated chain, the blast radius is enormous and immediate.
Alert relationships are invisible without lineage context. A freshness alert on table A and a volume alert on table B may look unrelated — until you realize that B is a downstream transformation of A and both were caused by the same source API going down. Without deep metadata context, these connections are invisible, and engineers waste time solving symptoms instead of causes.
Limited team resources make prioritization existential, not optional. Most data teams operate with 5 to 15 engineers responsible for hundreds of pipelines. When you cannot distinguish a critical issue affecting the CEO’s dashboard from a low-impact drift in a rarely-used staging table, you are allocating scarce engineering resources essentially at random.
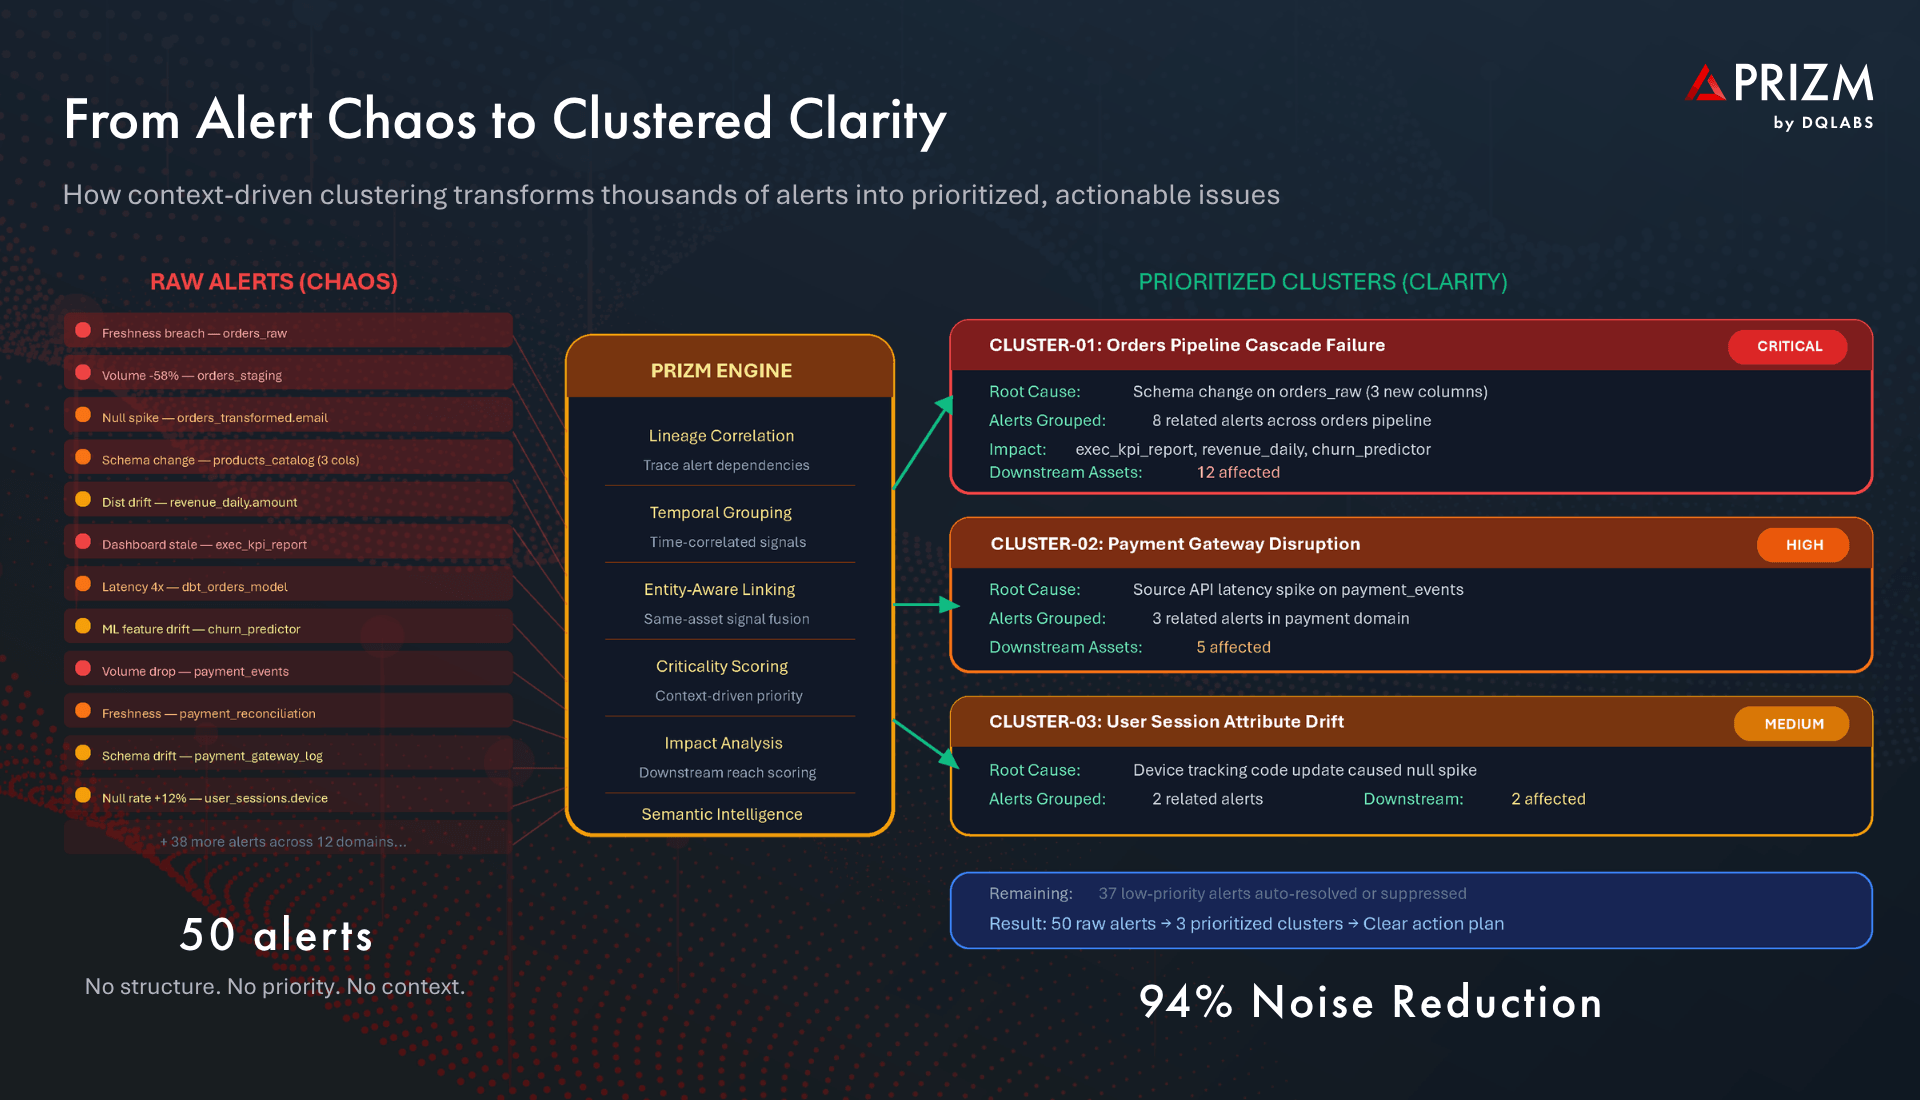
The Way Out: From Alert Chaos to Clustered Clarity
Escaping alert mode requires a fundamentally different approach — one that does not simply generate more or better alerts, but transforms raw signals into prioritized, context-rich issues that map to real root causes.
Alert Clustering: Group by Common Cause
Instead of presenting alerts as a flat stream of independent notifications, modern platforms use lineage correlation, temporal grouping, and entity-aware linking to cluster related alerts into unified issues. Eight alerts triggered by a single schema change become one clustered issue. Forty cascade alerts from a source outage become one incident with a clear origin point. The result: instead of drowning in thousands of raw alerts, teams work with a manageable set of 15 to 20 alert clusters that each represent a distinct, actionable problem.
Context-Driven Prioritization: Focus on What Matters Most
Clustering alone is not enough — clusters themselves need to be ranked. Modern platforms apply criticality scoring driven by the full context that observability generates: Which downstream assets depend on the affected data? How many consumers — dashboards, AI models, reports — are impacted? What is the business criticality of those consumers? How frequently is the data accessed? This context transforms a flat list of issues into a priority-ordered queue where the most business-critical problems surface first, and low-impact issues are deprioritized automatically.
Automated Root Cause Analysis: From Hours to Minutes
With lineage-aware RCA, the platform traces each clustered issue back to its origin point in the dependency chain. Rather than engineers manually investigating across five tools, the system presents a complete picture: the root cause event, the propagation path, every affected downstream asset, and a suggested remediation action. What took 2 to 8 hours of manual investigation now takes minutes.
The Continuous Intelligence Loop
The most advanced platforms deploy multi-agentic AI that continuously learns and adapts. Perception agents collect operational metrics every 10 minutes. Reasoning agents correlate anomalies with lineage and usage context. Decisioning agents perform RCA and impact analysis. Action agents route issues to the right teams via Jira, Slack, or PagerDuty — and can trigger automated remediation for known patterns. This Detect → Explain → Resolve loop continuously improves, reducing both mean time to detection (MTTD) and mean time to resolution (MTTR) with every incident.
What Changes When You Escape Alert Mode
The transformation is both operational and organizational:
- Engineers shift from firefighting to building. With 80–90% of alert noise eliminated through clustering, data teams reclaim the strategic capacity to improve pipelines, build data products, and advance platform maturity.
- Critical issues are resolved first, always. Context-driven prioritization ensures that the schema change affecting the executive revenue dashboard is the first thing the team sees — not the 147th.
- AI systems consume cleaner, timelier data. When pipeline issues are detected and resolved in minutes rather than days, ML models and AI agents operate on trustworthy data, reducing silent degradation and costly retraining cycles.
- Trust in data is restored across the organization. When stakeholders stop encountering stale dashboards and wrong numbers, the data platform becomes the asset it was always intended to be — and the data team is recognized for enabling decisions, not just keeping the lights on.
- Compliance posture strengthens. Continuous observability with automated audit trails makes it straightforward to demonstrate data health to regulators and governance teams.
Frequently Asked Questions
What is alert fatigue in data observability?
Alert fatigue occurs when data teams receive so many notifications from their observability tools that they begin ignoring or deprioritizing alerts. Research shows 60–80% of pipeline alerts are noise, and 73% of organizations have experienced outages from suppressed alerts. The core problem is not too few alerts, but too many without context, prioritization, or grouping.
What is alert clustering and how does it reduce noise?
Alert clustering uses data lineage, temporal correlation, and entity relationships to automatically group related alerts that share a common root cause into a single, consolidated issue. For example, a schema change that triggers 40 separate alerts across downstream assets is presented as one clustered issue with a clear root cause and impact assessment, reducing noise by 80–90%.
How does criticality scoring work in data observability?
Criticality scoring evaluates each alert cluster based on the business context of affected assets: how many downstream consumers depend on the data, what is the business importance of those consumers (executive dashboards vs. staging tables), how frequently the data is accessed, and whether SLAs are at risk. This context transforms a flat alert list into a priority-ordered queue.
What metrics should data teams monitor across their pipelines?
The core observability metrics include freshness (data timeliness relative to SLAs), volume (row count consistency), schema integrity (structural changes), completeness (null rates and missing values), distribution (statistical properties of data values), and latency (end-to-end processing time). Together, these provide comprehensive visibility into pipeline health.
How does automated root cause analysis work?
Automated RCA uses data lineage graphs to trace a detected anomaly or alert cluster back to its origin point in the pipeline. The system identifies the root cause event, maps the propagation path through downstream assets, and presents the full impact analysis with a suggested remediation action — reducing manual investigation from hours to minutes.
Why does alert fatigue impact AI and machine learning systems?
AI models and ML pipelines consume data automatically with no human validation checkpoint. When alert fatigue causes data engineers to miss pipeline issues, AI systems train on stale, incomplete, or drifted data — producing degraded predictions and decisions. The cost compounds silently because model degradation is often invisible until business outcomes deteriorate.
What is the difference between alerts and issues in data observability?
An alert is a raw signal that something has changed or breached a threshold — a single data point about one metric on one asset. An issue is a clustered, context-enriched event that groups related alerts, identifies the root cause, assesses downstream impact, and is prioritized by business criticality. Moving from alert-centric to issue-centric operations is the key to escaping alert mode.
About DQLabs
DQLabs is the probvider of Prizm, the industry’s first AI-native, self-driving platform for data observability and quality. Prizm delivers autonomous anomaly detection, intelligent alert clustering with context-driven criticality scoring, lineage-aware root cause analysis, and multi-agentic AI that continuously learns and adapts — transforming data teams from reactive firefighters to proactive builders of trusted data products.