
Summarize and analyze this article with
Data engineering teams today are inundated with alerts from data quality checks, pipeline monitors, and anomaly detection systems. Every schema change, delayed data load, or anomaly in a dataset can trigger notifications. When dozens of these alerts fire in parallel, it creates a noisy environment where distinguishing real issues from false alarms becomes a challenge. Alert clustering is one of the concepts that can help to cut through this noise.
In this blog, we’ll explore the challenges of traditional alerting without clustering, define what alert clustering means, and illustrate how it helps data teams focus on what truly matters. We’ll also cover common types of alerts data teams face, real-world examples of alert clustering in action for your data observability processes.
Challenge for Data Teams: Alert Overload and Fatigue
Monitoring data pipelines and quality at scale often leads to alert overload. Without any grouping mechanism, teams receive a flat stream of individual alerts that can quickly become unmanageable. This alert fatigue has real consequences: engineers start ignoring notifications, critical problems hide in plain sight, and response times slow down.
Here are some scenarios that highlight the pain points of traditional alerting:
- Changes trigger noisy alerts: A minor schema drift (e.g. a harmless column order change) might trigger a schema change alert. Similarly, normal weekend dips in user activity can fire off volume anomaly alerts. These alerts flag technical changes, but without context they may be low priority and simply add to the noise.
- Multiple alerts for one issue: Often a single underlying incident sets off a cascade of alerts. For example, a temporary upstream outage could produce a freshness alert (for data not arriving on time), several data quality alerts (as downstream validations start failing due to missing data), and a volume anomaly alert (due to an unexpected drop in row count). Each tool in your stack – from the ETL scheduler to the data observability platform – might fire its own alert for the same root cause. The team ends up with a flood of notifications for what is essentially one problem.
- Lack of context and prioritization: Traditional alerts often arrive devoid of business context. An alert might tell you “Table X row count dropped below threshold” but not whether Table X is critical to the business or just a testing dataset. With hundreds of such alerts, engineers struggle to triage what’s truly important. Low-priority alerts mix with high-priority ones, making it easy to miss the signal in the noise.
Over time, this constant barrage leads to alert fatigue. Teams start tuning out alerts or creating coarse filters to silence them. In the worst case, data issues go unresolved because the relevant alerts were lost in a sea of trivial warnings. Clearly, a new approach is needed to regain focus.
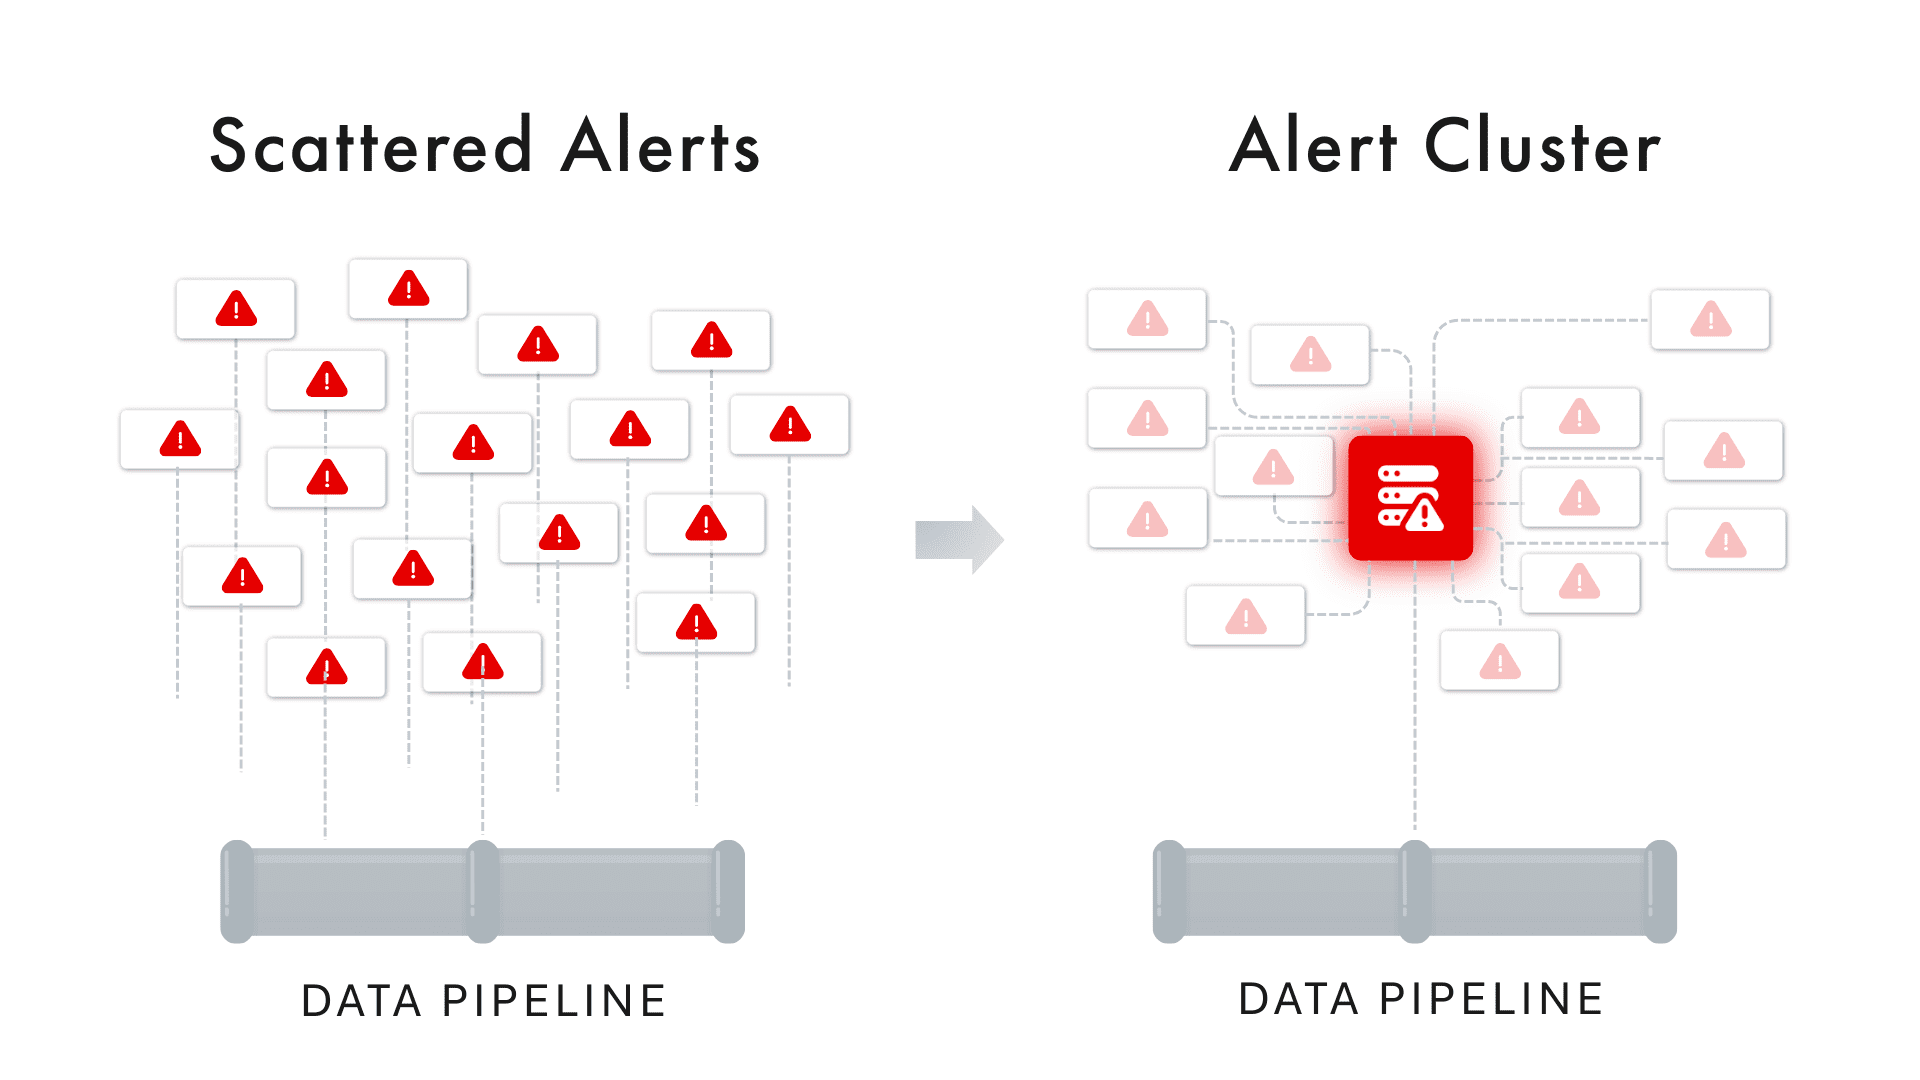
What Is Alert Clustering?
Alert clustering is the practice of automatically grouping related alerts together so that instead of many isolated notifications, the team sees a consolidated incident or alert group. In simple terms, alert clustering treats multiple individual alerts as symptoms of a larger issue and bundles them into one actionable unit. This grouping is typically based on shared context such as timing, affected data asset, shared lineage or common root cause.
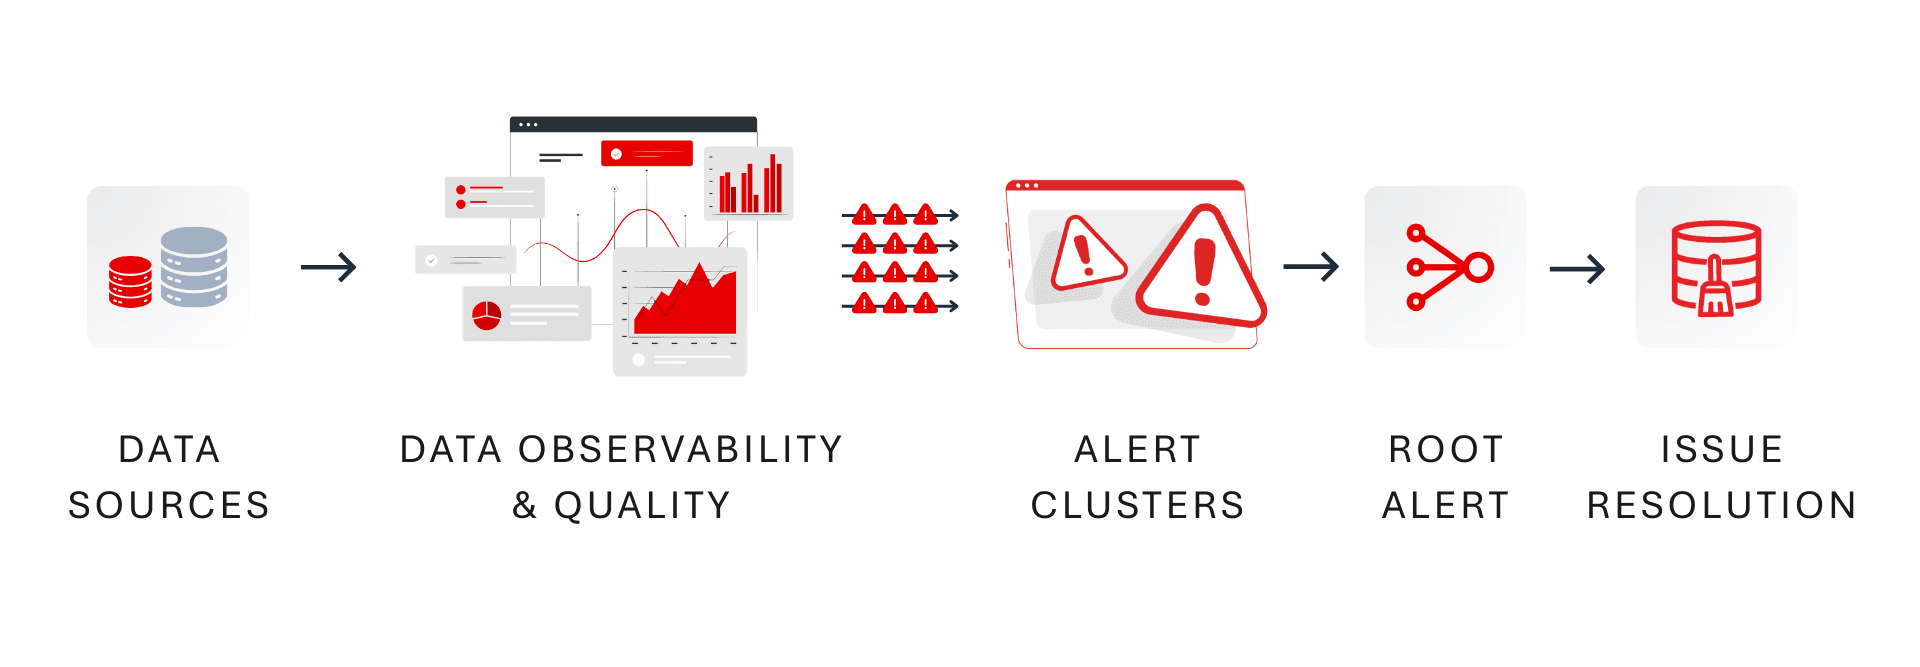
Think of the alert stream as a hierarchy of signals: at the lowest level you have raw anomalies (e.g. a specific metric breach), which trigger individual alerts. Alert clustering introduces a middle layer that groups those alerts by logical relationships, and the highest layer is a true incident that requires resolution. By clustering, 100’s of alerts can be distilled into a single incident report with a summary of what’s going on.
How does alert clustering decide what to group? Modern approaches use a combination of criteria to determine if alerts are related:
- Time Proximity: Alerts that occur around the same timeframe might be linked. For instance, if five alerts all fire within a 30-minute window, it’s a hint they could stem from one event. A clustering system may group alerts that occur within a configurable time window (say all anomalies within an hour of each other).
- Shared Data Asset or Pipeline: Alerts affecting the same dataset, table, or pipeline are strong candidates for clustering. If you get a freshness alert and a volume anomaly on the same table, plus a data validation error for that table, grouping them is logical – they’re all happening to one asset. This is a vertical grouping (within one data source).
- Common Domain or Source: Sometimes issues span multiple assets that are related. For example, a schema change in one database schema might trigger errors in several tables under that schema. Clustering can happen horizontally across related entities – grouping alerts across multiple tables or jobs that all share a dependency.
- Alert Type Similarity: Clusters can also consider the type of alert. If a dozen schema change alerts fire for different tables after a deployment, grouping them together as a single “schema change incident” can be more useful than separate pings for each table. Similarly, multiple volume anomalies on related datasets might belong to one cluster if they have a common cause (like a upstream job failure impacting all volumes).
- Data Lineage and Causality: The most powerful clustering approaches incorporate data lineage and causality analysis. By understanding upstream-downstream relationships, the system can link a root cause alert (e.g., “ETL job failed on source dataset”) with downstream symptom alerts (“downstream dashboard data is stale”, “volume drop in aggregate table”). Using lineage graphs or ML-driven correlation, the cluster can identify one alert as the likely root cause and others as its impact. This way, the cluster not only groups alerts but also surfaces the cause-and-effect structure within the group.
When alerts are clustered, the result is often presented as a single incident or issue in your alert console. Instead of seeing 10 separate notifications, you see one incident entry (sometimes called an alert cluster) which you can click into to view all the member alerts and their details. The incident will typically have a synthesized description – for example, “Freshness and Volume Anomalies on Sales_Orders – likely caused by upstream pipeline failure”. This high-level summary saves engineers from mentally stitching together clues across emails or Slack messages; the system does it for you.
Common Alert Types (and How One Issue Triggers Many)
To appreciate the value of clustering, consider the common types of data alerts that data engineers and analysts deal with daily. Any of these can occur alone, but often they occur in tandem when a single problem cascades through the data stack:
- Schema Change (Drift) Alerts: Triggered when the structure of data changes unexpectedly – for example, a column is added, removed, or its data type changes in a source table. Schema drift alerts help catch breaking changes, but minor or expected schema tweaks can generate noise if not handled carefully.
- Data Freshness Alerts: Activated when data isn’t updated by its expected schedule or SLA. For instance, if an hourly ETL job hasn’t landed new data by the deadline, a freshness alert will warn that the dataset might be stale.
- Volume Anomaly Alerts: These fire when the volume of data (row count, file size, number of records) deviates significantly from historical norms. A sudden drop or spike in a day’s data load – say you expected 1 million rows but only got 200,000 – would trigger a volume anomaly.
- Data Quality Rule Alerts: If data fails a defined quality check or validation rule, an alert is generated. This could catch issues like percentage of nulls exceeding a threshold, values out of an acceptable range, duplicates count too high, or any custom business rule being violated. Data quality alerts indicate the data content may be unreliable.
- Pipeline/Job Failure Alerts: When an orchestrated task fails (an Airflow DAG error, a DBT model build failure, etc.), a pipeline alert goes out. This is often a direct indication that some data didn’t get processed at all due to an error.
Crucially, these alerts are interrelated. A single failure can trigger multiple types of alerts. For example: imagine a nightly batch pipeline for Sales_Orders fails due to a SQL error. What alerts might you see the next morning?
- A pipeline failure alert from the orchestration tool indicating the job failed.
- A freshness alert on the Sales_Orders table because the data wasn’t updated on schedule.
- A volume anomaly alert because the daily row count in Sales_Orders is 0 or far below normal due to the failed load.
- Several data quality alerts from downstream reports or aggregations (e.g., a dashboard showing yesterday’s sales will have missing data, causing validations to fail).
In a basic alerting setup, these would come through as four or five separate alerts, possibly on different channels or from different systems. It’s easy for an on-call engineer to get overwhelmed by the barrage: “What exactly is going on? Are these separate issues or all one thing?” This is where alert clustering proves its worth by grouping all these alerts into one incident and highlighting their interconnection.
Alert Clustering in Action: Real-World Examples
Let’s consider a couple of real-world scenarios to see how alert clustering changes the game for data teams:
Example 1: One Schema Change, Many Failures
A retail company updates the schema of a critical Customers table, adding a new column and altering a data type, without properly communicating to downstream teams. Overnight, this single change causes three separate ETL jobs that depend on Customers to fail (each job expecting the old schema).
Without clustering, the data team gets at least three failure alerts (one per job), plus a schema change alert from the data observability tool, and perhaps even more alerts as downstream data checks fail. That’s 4–5 alerts hitting the team’s inbox or Slack in quick succession.
With alert clustering, however, all these get rolled up into one incident. The clustered incident might be titled “Schema change in Customers table causing downstream job failures” and contain the list of the three job failures and the schema change event. Instead of treating each alert as an isolated issue, the team immediately sees the common thread: fix the schema compatibility and all the related failures will resolve. This not only reduces noise, it also accelerates root cause analysis – engineers spend less time flipping between alerts and more time addressing the actual problem.
Example 2: Pipeline Outage Triggers Anomaly Storm
Imagine a fintech data team that loads transaction data every hour. One morning, the source API had an outage, causing the 6AM and 7AM data pipeline runs to fail silently. What happens next is a textbook alert storm: a freshness alert by 8AM because the transaction table hasn’t updated, a volume anomaly alert when the morning’s record count is far below normal, and multiple data quality alerts on reports that now have missing recent data. Moreover, when the pipeline finally runs at 9AM, it ingests a big spike of delayed data, which could trigger a volume spike anomaly as well.
Without clustering, the on-call engineer might receive five or six pings, all worded differently – one saying “Job X failed”, another saying “Table Y is stale”, another “Unusual low volume in Table Y”, and so on. It’s easy to waste precious time treating these as separate tickets.
With alert clustering, all those related alerts (time-correlated and asset-correlated) will unify into one incident report: e.g. “Transaction data delayed: Freshness SLA missed and volume anomalies detected for Table Y (likely due to upstream source outage).” The engineer can immediately grasp that these symptoms have one cause. The cluster view would show the timeline – job failures at 6/7AM, followed by the freshness and volume alerts – confirming they’re all part of the same chain of events. The team can then focus on the root cause (the source outage or pipeline fix) rather than chasing each alert separately.
These examples show the clear difference in workflows. Without clustering, an issue in your data platform can feel like an avalanche of alerts, each requiring triage. With clustering, that same issue is presented as a single, coherent story. This leads to faster understanding, quicker root cause identification, and a much calmer on-call experience.
Benefits of Alert Clustering for Data Teams

Alert clustering delivers several key benefits that directly address alert fatigue and improve incident response:
- Noise Reduction: The most immediate benefit is cutting down the number of notifications. By consolidating multiple alerts into one cluster, teams aren’t bombarded by redundant messages. This reduces alert noise dramatically, so engineers can actually pay attention to the alerts that do come through. A cleaner inbox or Slack channel means critical issues are far less likely to be overlooked.
- Faster Incident Triage: When related alerts are grouped, triage becomes faster. All the evidence is in one place, so you spend less time correlating logs and metrics across tools. The cluster often provides a summary or at least a contextual grouping that points toward the root cause (for example, all alerts involve the same data source or happened in the same time window). This context allows on-call responders to zero in on the problem quickly. In many cases, clustering can highlight a root cause alert (like a pipeline failure) at the top of the incident, with all symptom alerts linked beneath it.
- Improved Signal-to-Noise Ratio: With clustering, teams can introduce more monitoring and detection (catching every anomaly) without drowning in alerts. This is important in data observability – you want to monitor many aspects (freshness, volume, schema, quality, etc.), but you don’t want an alert for each tiny blip. Clustering ensures that a broad net of monitors yields actionable incidents rather than myriad trivial tasks. It essentially prioritizes what matters by grouping minor symptoms under bigger issues.
- Lower Mean Time to Resolve (MTTR): Ultimately, the goal of any alerting improvement is to resolve data issues faster. By decluttering alerts and speeding up diagnosis, clustering helps reduce the time it takes to fix problems. When an incident is grouped and contextualized, the data team can often skip straight to remediation steps (since they can quickly tell what subsystem failed or which upstream change caused it). This minimizes data downtime and its impact on the business.
- Less Burnout, Better Focus: On the human side, reducing alert fatigue means engineers feel less overwhelmed and more in control. Instead of constantly reacting to noisy alerts (and potentially missing vacations or sleep for false alarms), they can trust that when they are paged, it’s truly important. Over the long run, this fosters a more proactive and positive on-call culture. Teams can spend their energy on preventative improvements and data reliability initiatives, rather than firefighting a barrage of alerts.
- Structured Incident Management: Alert clustering often dovetails with incident management processes. Each cluster can be tracked as a single incident ticket, with all related information attached. This makes post-incident review easier – you can review one incident that had multiple symptoms, rather than multiple disjoint tickets. It also simplifies handing off issues between team members or updating stakeholders, since you have one incident ID to reference. In effect, clustering brings a level of organization and clarity to what would otherwise be a chaotic swarm of signals.
In summary, alert clustering transforms the alerting experience from a noisy alarm bell into a focused spotlight. It helps data teams maintain trust in their monitoring: when an alert fires (or an incident is raised), it’s meaningful and actionable. This aligns perfectly with the larger goal of data observability – not just detecting every blip, but ensuring data reliability issues are detected and resolved with minimal friction.
Conclusion
In the evolving landscape of data observability and reliability engineering, alert clustering stands out as a powerful technique to manage complexity. Data teams no longer have to play the role of human correlators, piecing together dozens of alerts to figure out what went wrong. Instead, with alert clustering, the system presents a coherent narrative of events, allowing engineers to spend their time solving problems rather than sifting through noise.
The shift to clustered alerts is more than a technical tweak – it fosters a cultural change towards proactive data operations. Engineers start to trust the alerts they receive and develop confidence that they’re not missing critical issues buried in noise. This trust is crucial for a strong data-driven organization: when data incidents are promptly identified and resolved, stakeholders regain faith in the data itself.
In practice, implementing alert clustering requires thoughtful setup and possibly adopting advanced tools like Prizm by DQLabs. But the payoff is clear. Teams that harness alert clustering experience significantly less alert fatigue, faster resolution times, and more sleep-filled nights for on-call personnel. They can broaden their monitoring coverage (knowing the clustering will handle the noise) and thus catch more issues before they impact the business, all while keeping the alert load manageable.