Summarize and analyze this article with
In today’s data-driven world, simply monitoring a single aspect of your data stack isn’t enough. Multi-layered data observability is emerging as a holistic approach to ensure data reliability and trust across every layer – from raw data quality to pipelines, infrastructure, and end-user analytics. This blog breaks down what multi-layered observability means, why it matters now more than ever, and how organizations can implement it to gain end-to-end visibility into their data.
What is Data Observability?
Data observability is the ability to gain full visibility into the health and movement of data across systems. In simple terms, it means having eyes on your data at all times – knowing when data is wrong or delayed, what broke, and why. (For a deeper dive into the fundamentals, check out our What is Data Observability blog.) Multi-layered data observability extends this concept by applying it across all layers of the data ecosystem. Instead of observing data in isolation, you monitor every layer – the data itself, the pipelines that transform it, the infrastructure powering it, and even the ways it’s used – to catch issues anywhere in the chain. This comprehensive approach ensures there are no blind spots in delivering accurate, timely, and trustworthy data.
Why Multi-Layered Observability Matters in 2025
Data environments are more complex in 2025 than ever before. Organizations now operate on hybrid and multi-cloud platforms with dozens of data tools. Data is flowing in real-time streams, feeding critical AI models and dashboards. At the same time, expectations for data quality and reliability are sky-high – businesses cannot afford broken pipelines or “data downtime” when decisions depend on always-on insights. Multi-layered observability is crucial because it addresses this complexity head-on. It provides a unified, real-time view of data across sources and systems, which is essential for maintaining trust as data volumes and speeds grow. In an era where AI and analytics drive competitive advantage, having observability across all layers means you can confidently rely on your data (and catch anomalies before they wreak havoc). Simply put, a multi-layered approach is the antidote to modern data chaos, ensuring agility, compliance, and informed decision-making.
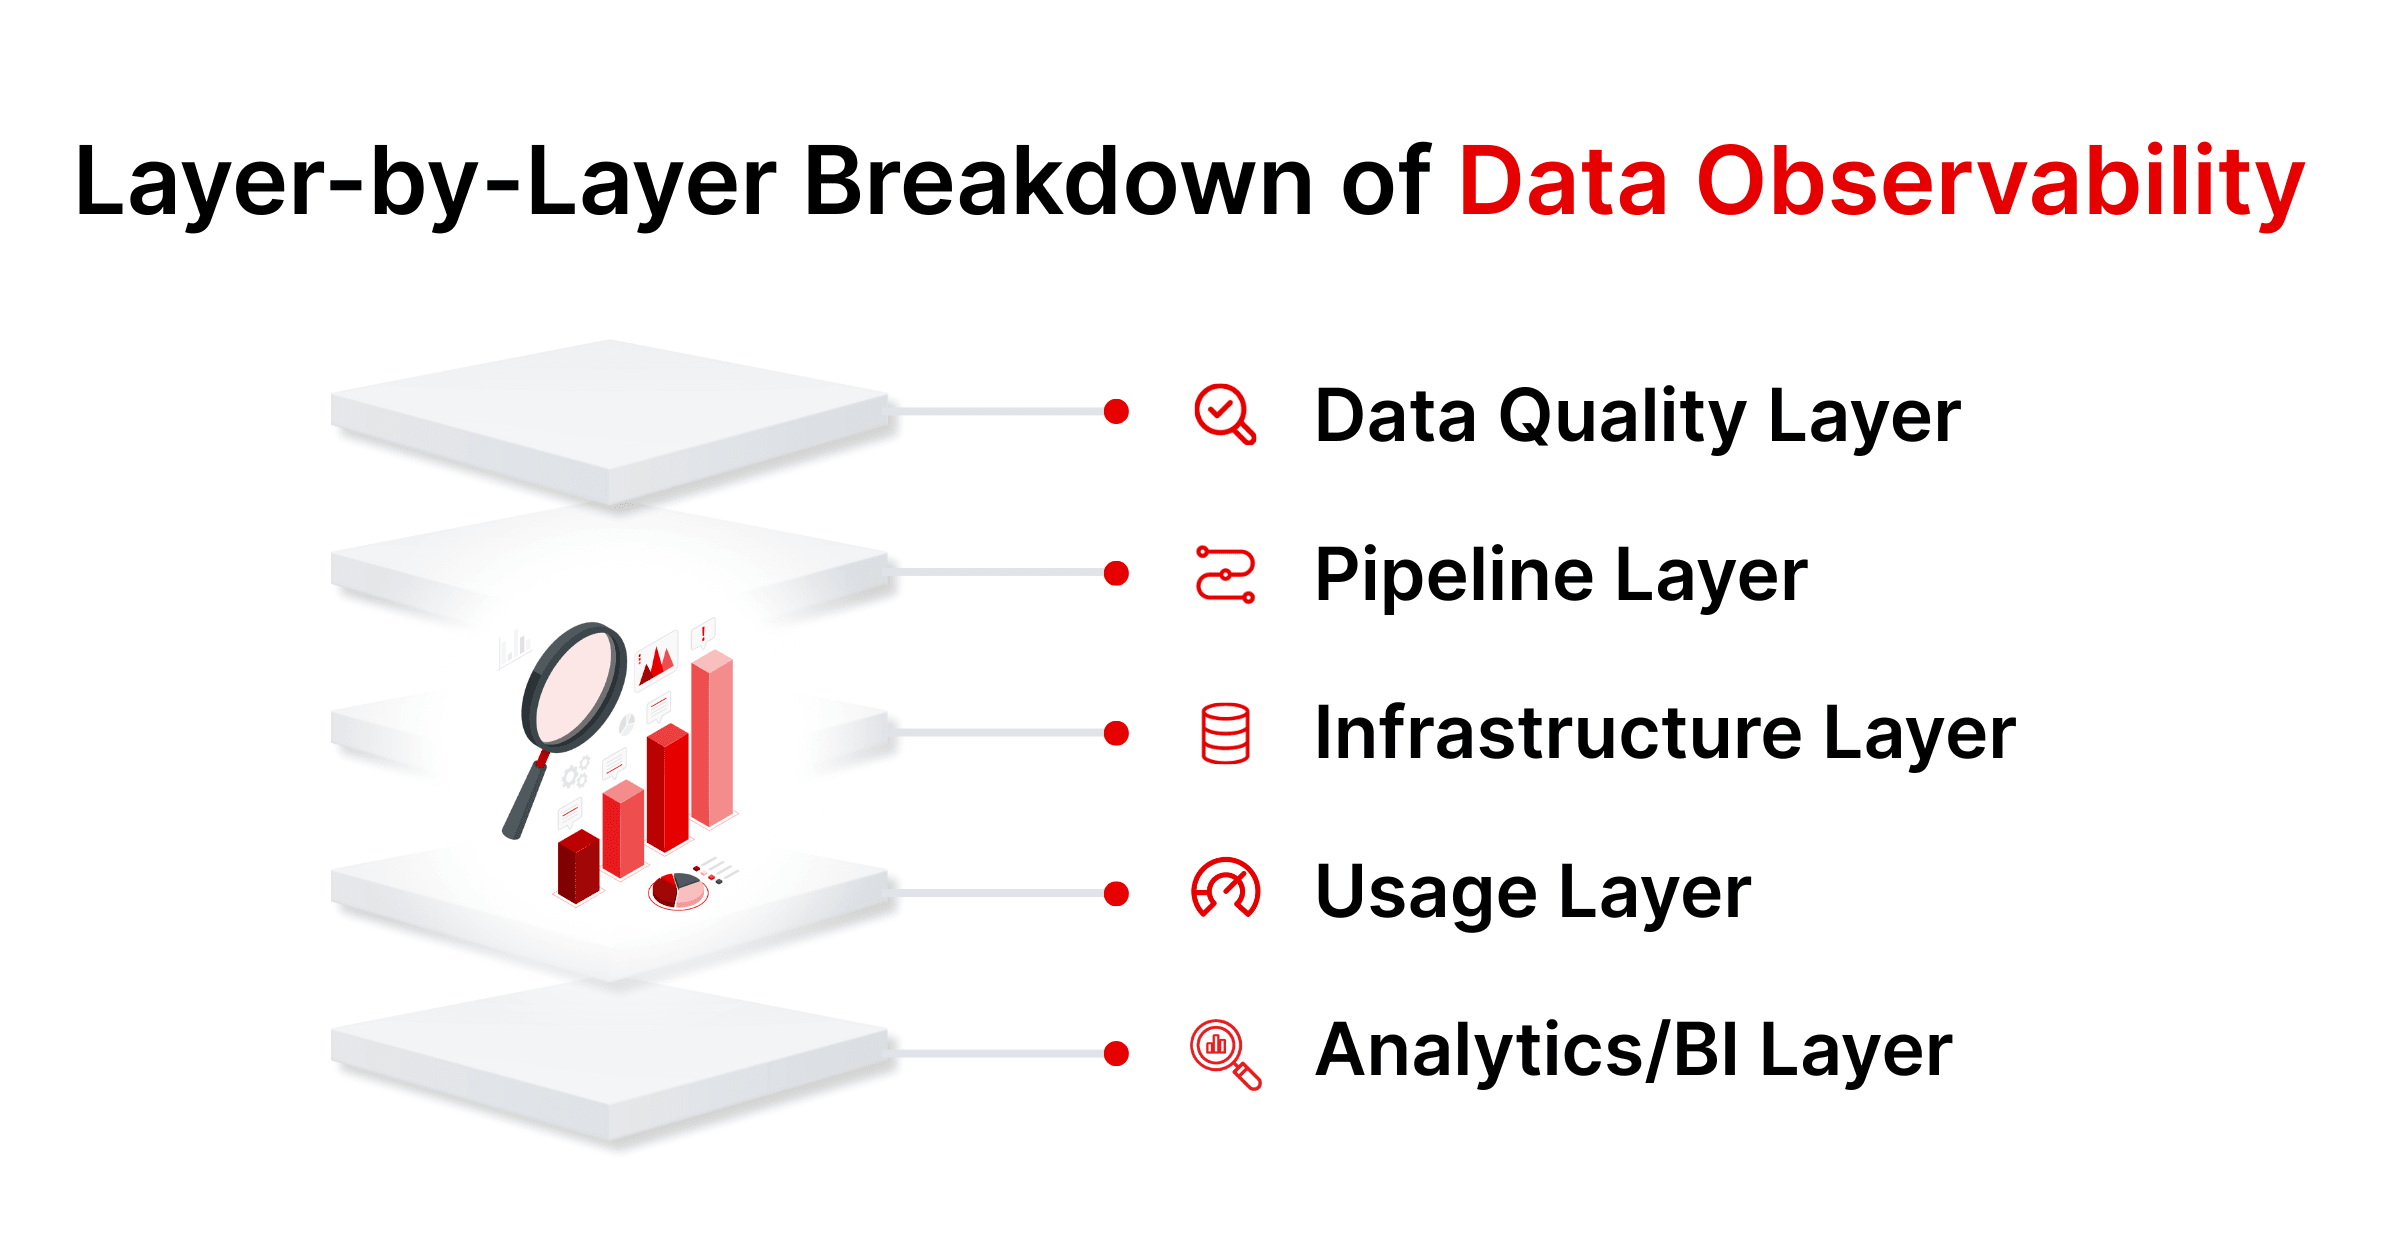
Layer-by-Layer Breakdown of Data Observability
To understand multi-layered observability, consider the key layers of a modern data stack and what needs monitoring at each:
- Data Quality Layer: Monitoring the content of data – its accuracy, completeness, consistency, and freshness. This layer detects anomalies, missing values, schema changes, or out-of-range metrics in datasets, ensuring the data itself is fit for purpose.
- Pipeline Layer: Observing ETL/ELT and data integration pipelines – tracking data flows, transformations, and job status. Here you catch failed jobs, slow processing, or broken data dependencies in real time, enabling quick fixes in your data pipelines. For a detailed exploration of how to achieve comprehensive pipeline observability, see our Data Pipeline Observability blog.
- Infrastructure Layer: Keeping an eye on the platform and resources behind your data – cloud data warehouse performance, database storage, compute clusters, memory and CPU usage, etc. This ensures your data infrastructure (e.g., Snowflake, Databricks, AWS environments) is running smoothly and can scale without bottlenecks.
- Usage Layer: Monitoring how data is queried and consumed. This involves tracking query performance, user behavior, and even costs. By observing usage patterns in data warehouses and reports, you can optimize slow queries, manage cloud compute costs, and ensure important business queries are getting the performance they need.
- Analytics/BI Layer: Validating the last-mile output – dashboards and reports. This layer of observability makes sure your BI tools (like Power BI or Tableau reports) are receiving healthy data and remain trustworthy. It includes monitoring dashboard refreshes, data lineage from source to report, and alerting if a report’s data suddenly looks off.
By addressing each of these layers, multi-layered observability provides a 360-degree view of data health. It connects the dots from raw data capture all the way to business insight, so teams can pinpoint exactly where issues occur and address them before they propagate downstream.

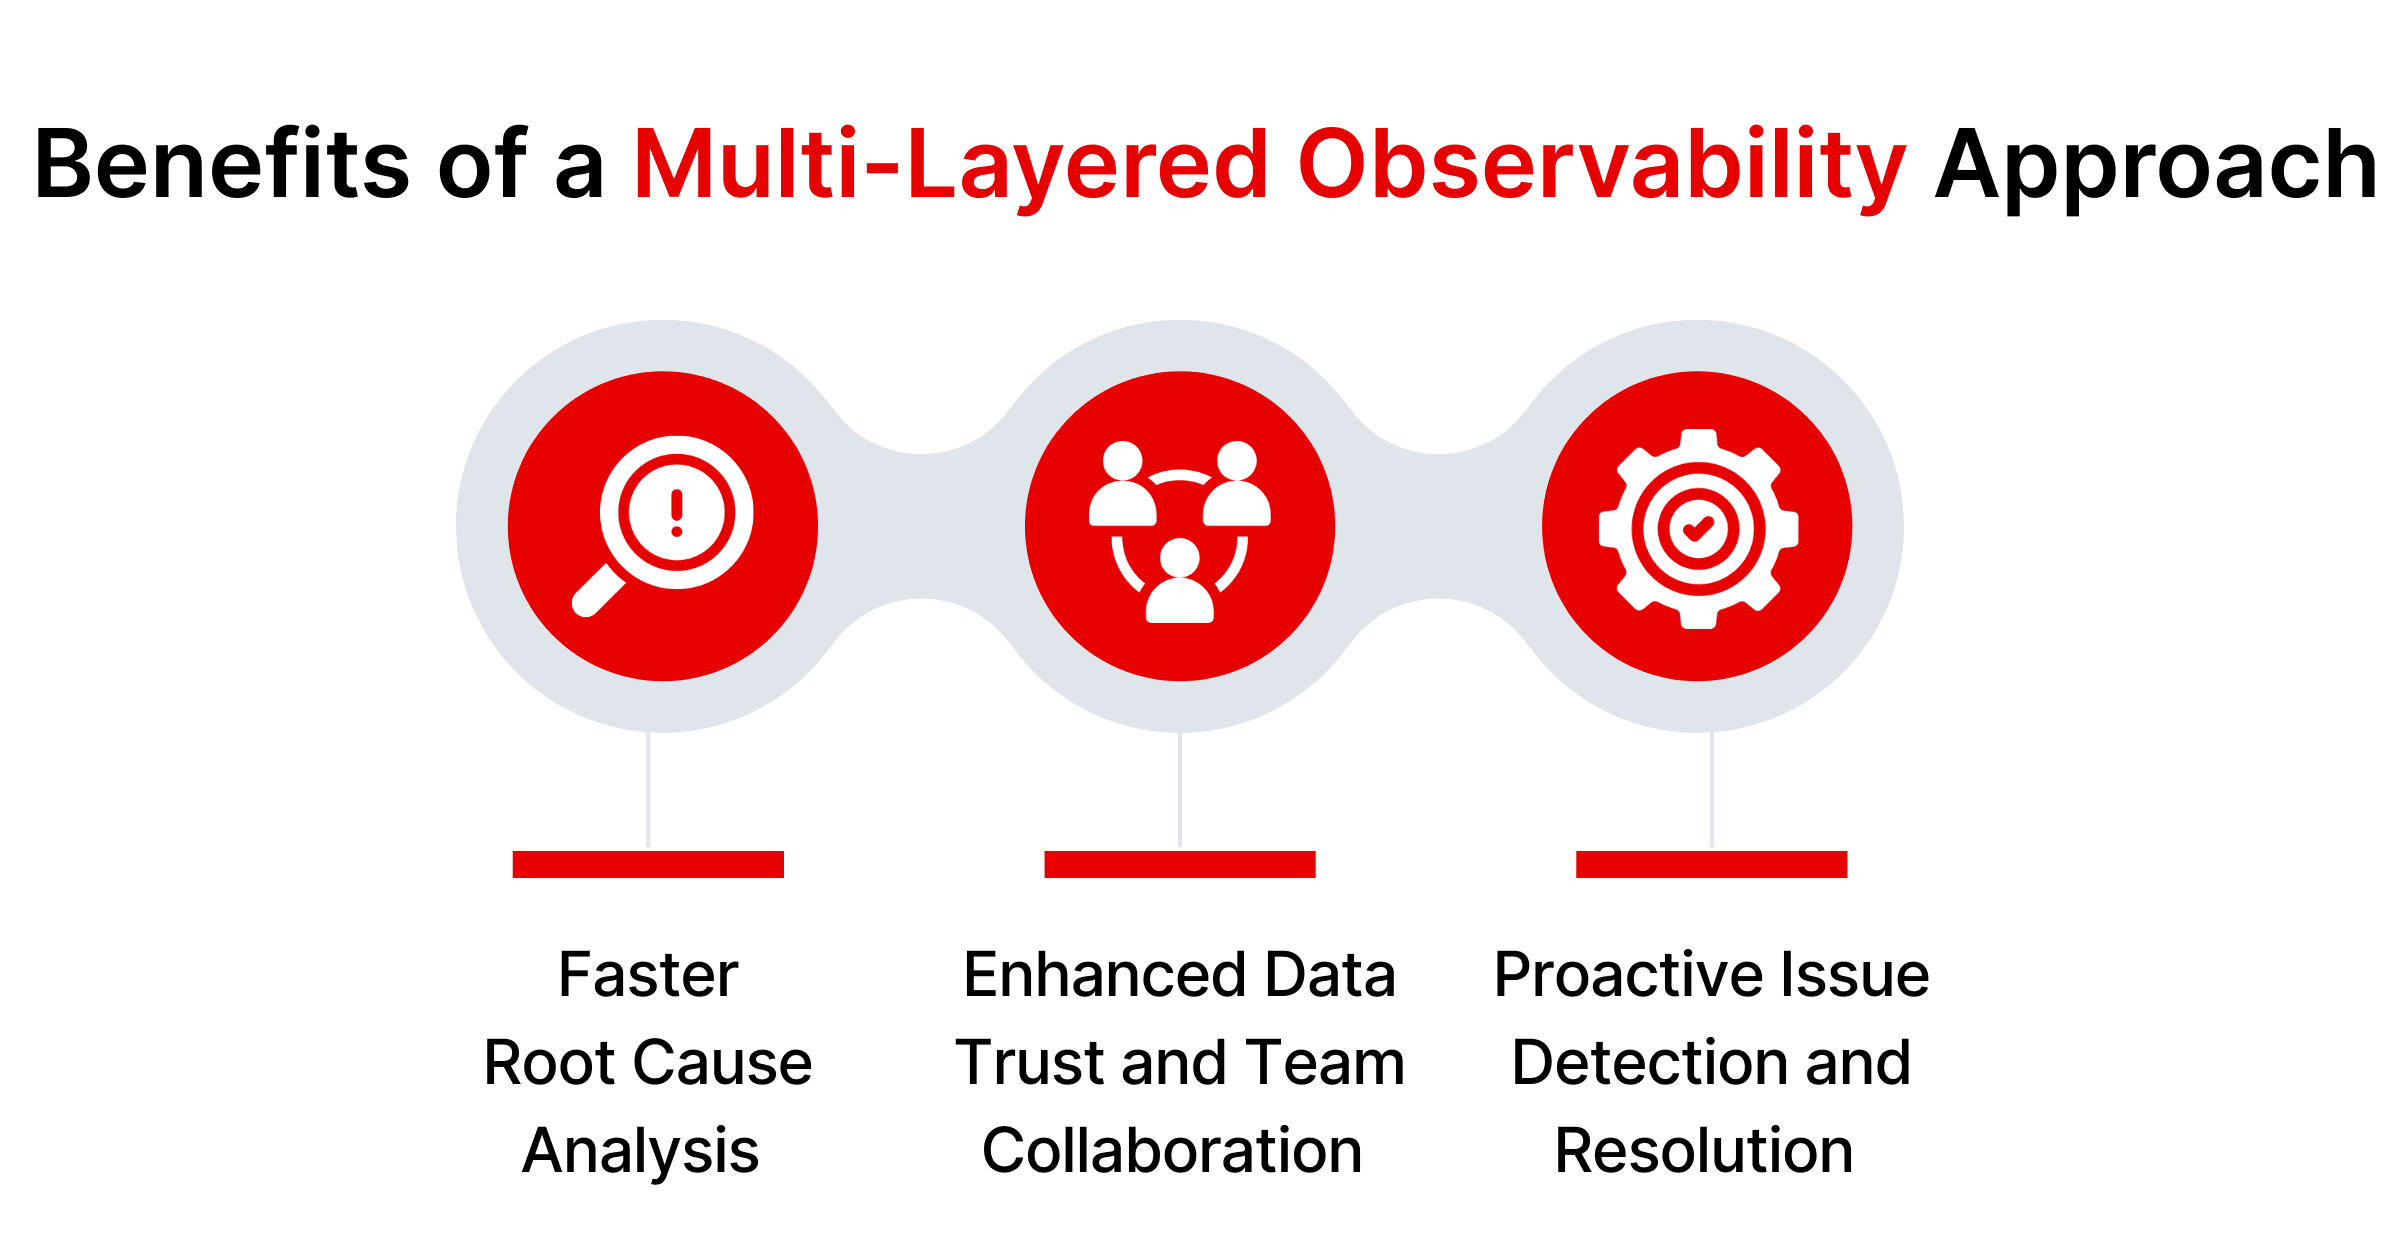
Benefits of a Multi-Layered Observability Approach
Adopting a multi-layered observability strategy brings several powerful benefits to organizations:
Faster Root Cause Analysis
When issues arise, multi-layered observability enables teams to quickly pinpoint the root cause by monitoring across data, pipelines, and infrastructure. Instead of guessing why a dashboard looks off, teams can trace the problem—like a failed pipeline or upstream schema change—within minutes, reducing downtime and restoring trust faster.
Enhanced Data Trust and Team Collaboration
By continuously validating data and sharing observability insights across teams, organizations build a culture of trust. Data engineers, analysts, and governance teams work from the same view of data health, reducing silos and finger-pointing. This shared visibility promotes faster resolution and better cross-functional collaboration.
Proactive Issue Detection and Resolution
Unlike traditional monitoring, multi-layered observability helps detect and address anomalies before they impact users. Sudden changes in data volume or latency can trigger real-time alerts, allowing teams to act early. With AI/ML, some issues can even be resolved automatically—like auto-scaling infrastructure or reverting schema changes—leading to a more resilient, self-healing data ecosystem.

How Multi-layered Data Observability Differs from Traditional Monitoring
Multi-layered data observability isn’t just a fancy term for monitoring – it represents a new philosophy. Here’s how it stands apart from old-school approaches:
Monitoring vs. Observability
Traditional data monitoring focuses on a narrow set of known metrics—like whether a server is up or if a data pipeline is completed. It’s reactive, relying on predefined thresholds and rules. Monitoring can alert you that something is wrong but doesn’t always explain why it happened.
Data observability takes a broader, more proactive approach. It pulls in granular telemetry—logs, metrics, events, and traces—from every layer of the data stack to provide deeper context. This lets teams detect not just known issues, but also “unknown unknowns” by correlating patterns across systems. In short, observability helps data teams troubleshoot faster, uncover root causes, and improve reliability over time—not just respond to surface-level alerts.
Why Simple Dashboards Aren’t Enough Anymore
Static dashboards and periodic reports were once enough to monitor pipelines and data quality, but they’re inherently reactive. They often show issues only after the fact—like a drop in volume or a spike in errors. They also operate in silos, offering no correlation between infrastructure metrics and data anomalies.
Modern data ecosystems demand more. Multi-layered observability connects signals across systems in real time—automatically linking a failed ETL job to a surge in query errors or report delays. It replaces manual monitoring with intelligent alerts and context-rich insights, so teams aren’t stuck watching graphs. Instead, they can focus on fixing problems proactively and driving value from trustworthy, well-performing data.
Challenges of Implementing Multi-Layered Observability
Embracing a multi-layered observability strategy comes with its own set of challenges. Being aware of these hurdles can help in planning and choosing the right solutions:
Tool Integration and Complexity
Modern data stacks are composed of diverse tools and platforms—databases, pipelines, BI systems, and more. Implementing observability across all layers can be difficult if it requires multiple tools that don’t integrate well. Without a unified approach, teams risk creating “observability silos” that mirror existing data silos. Choosing a comprehensive platform that seamlessly connects with your tech stack is essential to reduce complexity and ensure centralized visibility.
Skill Gaps and Team Readiness
Multi-layered observability is still new for many teams, and interpreting its metrics or configuring smart alerts often requires cross-functional skills spanning DevOps, data engineering, and analytics. Organizations may need to invest in training, hire for new roles, or upskill existing teams. Just as critical is cultural readiness—teams must embrace a proactive mindset and integrate observability into daily workflows.
Scaling Across Distributed Environments
With data spread across cloud, on-prem, and third-party systems, observability must scale across regions and workloads. High telemetry volumes can overwhelm both systems and people, leading to alert fatigue. Success depends on scalable platforms, intelligent alerting, and continuous tuning to surface only the most relevant insights while keeping performance and costs in check.
Implementation Tips for Success
Implementing multi-layered data observability can be a transformative project. Here are some practical tips to ensure a successful rollout:
- Start with a Clear Scope: Begin by identifying the most critical data assets and pipelines in your organization. Implement observability for these key areas first. This focused approach lets you demonstrate quick wins and learn lessons before scaling out.
- Leverage Unified Platforms: Whenever possible, use a tool or platform that covers multiple observability layers out-of-the-box. A unified observability platform (like DQLabs) can reduce integration efforts by providing modules for data quality, pipeline monitoring, and more in one place.
- Integrate with Existing Workflows: Embed observability into your team’s daily routine. For example, configure alerts to flow into your collaboration tools (Slack, Microsoft Teams) or issue trackers (Jira) so that when an anomaly is detected, the right people are notified in their normal workstream. This ensures observability insights lead to immediate action.
- Invest in Training and Culture: Educate your data engineers, analysts, and even business users about what data observability is and how to interpret its outputs. Encourage a culture where team members regularly check observability dashboards and treat data incidents with the same urgency as application downtime.
- Fine-tune and Evolve: Treat the implementation as an iterative process. Adjust monitoring thresholds to the right sensitivity (avoiding too many false alarms). Add new checks as you discover what metrics best indicate health for your systems. Multi-layered observability will evolve with your data stack – keep refining it as you integrate new data sources or as usage patterns change.
By following these tips, organizations can embed observability deeply and seamlessly, rather than as an afterthought. The payoff will be a more resilient, transparent data environment that teams can trust.
Use Cases Across Industries
Multi-layered data observability is not just a tech buzzword – it delivers real-world value across various industries. Here are a few examples of how different sectors benefit:
Finance: Detecting Fraud and Compliance Gaps
Banks and fintechs rely on accurate, timely data to prevent fraud and meet strict regulatory standards. Observability helps detect anomalies—like sudden transaction spikes or unusual patterns—before they escalate. With end-to-end lineage and audit trails, financial institutions can demonstrate data integrity for critical reports (e.g., credit risk or trading logs). This ensures both regulatory compliance and customer trust by identifying issues in real-time and showing complete data traceability.
Healthcare: Ensuring Patient Data Accuracy
In healthcare, where data is fragmented and sensitive, observability ensures patient records are accurate and complete across systems. It flags issues like dropped fields in HL7 messages or failed data transfers between labs and hospital databases. By monitoring both content quality and pipeline health, hospitals can prevent poor clinical decisions caused by bad data. It also supports HIPAA compliance by tracking unusual access or mismatches—safeguarding patient privacy and care quality.
E-commerce: Real-Time Inventory and User Metrics
Retail and eCommerce businesses thrive on real-time data. Observability ensures smooth operation of pipelines feeding inventory updates, sales, and user activity. If a warehouse feed fails or clickstream tagging breaks, alerts are triggered immediately—preventing overselling or lost analytics. Usage observability also helps during peak events, enabling ops teams to scale infrastructure in advance based on real-time demand. Ultimately, this leads to better customer experiences, accurate marketing insights, and responsive business operations.
Top Tool for Multi-Layered Data Observability
When evaluating solutions for multi-layered observability, it’s important to choose a platform that truly spans all the necessary layers and is easy to integrate. One standout option is DQLabs, which has emerged as a top tool for comprehensive data observability and quality management.
DQLabs – is an AI-powered data platform that offers end-to-end observability across your data stack. It is designed to monitor data health at multiple layers – including data quality, pipelines, and even data consumption – all within a unified interface. DQLabs provides out-of-the-box checks for key data quality metrics (such as schema consistency, data freshness, volume changes, and uniqueness), automatically flagging anomalies or schema changes that could affect downstream analysis. At the pipeline layer, DQLabs integrates with popular data integration and ETL/ELT tools to track job execution, data transformations, and dependencies. This means you get immediate alerts if a workflow in Azure Data Factory, dbt, Airflow, Fivetran, or other pipeline tools fails or slows down.
A distinctive feature of DQLabs is its focus on usage and analytics observability. It connects with major cloud data warehouses and analytics platforms to monitor query performance and BI reports. For example, DQLabs can track how queries are running on Snowflake or Databricks and identify long-running or inefficient queries that might inflate costs or cause delays. It also offers visibility into BI tools – giving centralized insight into the status of Power BI or Tableau reports, and tracing data lineage to each dashboard. This helps data teams quickly see if a broken data element upstream might impact a CEO’s dashboard, and fix it before it becomes a business issue.
Another strength of DQLabs is its easy integration into the modern data ecosystem. It provides pre-built connectors for a wide range of technologies. DQLabs seamlessly integrates with cloud data platforms like Snowflake, Databricks, and AWS data stores, ensuring it can observe data no matter where it resides. It also plays well with data governance and catalog tools – for instance, integrating with Atlan, Alation, DataGalaxy, and Data.World to enrich those catalogs with real-time data quality metrics and lineage. This means you can see DQLabs observability insights directly in your data catalog or governance dashboards, providing context to data stewards and users about each dataset’s health and history.
Powered by machine learning, DQLabs doesn’t just collect data – it intelligently prioritizes alerts (helping reduce noise and “alert fatigue” by highlighting what’s truly critical) and even suggests resolutions for certain issues. Its no-code, user-friendly interface makes it accessible to both technical and business users, which is key for collaboration. In 2025, DQLabs has been recognized by industry analysts for its innovative approach (it’s ranked among leaders in data observability and quality solutions), underscoring its capability to deliver multi-layered observability in practice. For organizations evaluating tools, DQLabs stands out as a platform that can unify observability across data, pipelines, and usage, all while complementing the rest of your data infrastructure.
Looking Ahead: The Future of Observability
As data ecosystems grow in complexity, multi-layered observability is shifting from a nice-to-have to a foundational requirement. The future lies in intelligent, AI-powered observability platforms that not only detect anomalies but also resolve them automatically—think self-healing pipelines and AI observability that monitors model drift and bias in real-time. Observability will also play a critical role in compliance by offering traceability across the entire data supply chain, while “observability-as-code” will embed monitoring directly into pipelines from day one.
Adopting multi-layered observability today means building for a smarter, more resilient tomorrow. It empowers teams with real-time insights, fosters trust in data, and supports faster, more informed decisions. Organizations that invest now will be better equipped to manage data at scale, respond to change, and turn data reliability into a competitive edge.
FAQs
What is multi-layered data observability?
Multi-layered data observability is an approach to monitoring and analyzing data that covers all layers of the data stack. Instead of only tracking one aspect (like just pipelines or just data quality), it provides end-to-end visibility – monitoring data quality, pipeline health, infrastructure performance, and data usage together. The goal is to get a holistic view of data health, so you can quickly pinpoint issues no matter where they occur (in the data itself, in the ETL process, in the database, etc.). It’s essentially a comprehensive form of data observability that leaves no blind spots in your data ecosystem.
How is data observability different from traditional data monitoring?
Traditional data monitoring is siloed and reactive—checking if systems are running or jobs are complete. It’s largely reactive and siloed. Observability, especially when multi-layered, offers a unified, proactive view. It correlates signals (logs, metrics, anomalies) from across systems to explain not just what broke, but why. The result is faster insights and more effective troubleshooting.
What are the key layers of data observability?
The main layers include:
- Data Quality Layer: Ensures accuracy and integrity of the data.
- Pipeline Layer: Monitors data flow and processing health.
- Infrastructure Layer: Tracks performance and resource usage in data platforms.
- Governance/Metadata Layer: Monitors schema changes and data lineage.
Together, these layers offer a complete picture from ingestion to insight.
How can we implement multi-layered data observability effectively?
Start by selecting a platform that supports multiple layers or integrates well with your stack. Map your architecture and configure key monitors—such as data quality rules, job failure alerts, infrastructure thresholds, and dashboard health. Roll out in phases, focusing first on critical pipelines or datasets. Integrate alerts into existing workflows (Slack, Jira, etc.), train your team, and refine over time to minimize noise. The goal is a reliable system that quietly ensures everything is running smoothly, and only flags what truly needs attention.
Why is multi-layered observability important for data governance?
Multi-layered observability supports data governance by providing evidence and insights that policies are being followed across the data lifecycle. For example, governance might dictate that critical customer data must be up-to-date and complete – observability on the data quality layer will immediately flag if that’s violated. Governance also involves knowing where data comes from and how it’s used; observability provides detailed lineage and usage metrics that help governance teams see if data is flowing and accessed as expected. Moreover, observability can catch issues like unauthorized access patterns, unexpected schema changes, or data drift that could pose governance risks. By monitoring these events in real time, organizations can enforce governance standards proactively rather than catching problems in audits long after the fact. In summary, multi-layered observability acts as the technical watchtower for data governance, continuously scanning for anything that might compromise data integrity, security, or compliance.


 Claude
 ChatGPT
 Perplexity
 Grok
Grok Google AI